Exam 13: Inference About Comparing Two Populations
Exam 1: What Is Statistics46 Questions
Exam 2: Graphical Descriptive Techniques 194 Questions
Exam 3: Graphical Descriptive Techniques 2156 Questions
Exam 4: Numerical Descriptive Techniques275 Questions
Exam 5: Data Collection and Sampling84 Questions
Exam 6: Probability240 Questions
Exam 7: Random Variables and Discrete Probability Distributions283 Questions
Exam 8: Continuous Probability Distributions224 Questions
Exam 9: Sampling Distributions156 Questions
Exam 10: Introduction to Estimation154 Questions
Exam 11: Introduction to Hypothesis Testing189 Questions
Exam 12: Inference About a Population153 Questions
Exam 13: Inference About Comparing Two Populations170 Questions
Exam 14: Analysis of Variance157 Questions
Exam 15: Chi-Squared Tests179 Questions
Exam 16: Simple Linear Regression and Correlation304 Questions
Exam 17: Multiple Regression160 Questions
Exam 18: Model Building148 Questions
Exam 19: Nonparametric Statistics175 Questions
Exam 20: Time-Series Analytics and Forecasting225 Questions
Exam 21: Statistical Process Control140 Questions
Exam 22: Decision Analysis123 Questions
Exam 23: Conclusion47 Questions
Select questions type
When testing  the observed value of the z-score was found to be −2.15.Then,the p-value for this test would be
(Multiple Choice)
4.7/5  (39)
(39)
Speed Limits Violation
Do out-of-state motorists violate the speed limit more frequently than in-state motorists? This vital question was addressed by the highway patrol in a large eastern state.A random sample of the speeds of 2,500 randomly selected cars was categorized according to whether the car was registered in the state or in some other state and whether or not the car was violating the speed limit.The data follow. 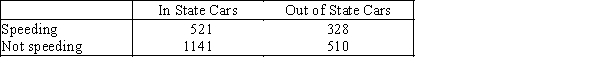
-{Speed Limits Violation Narrative} Estimate with 95% confidence the difference in population proportions.
-{Speed Limits Violation Narrative} Estimate with 95% confidence the difference in population proportions.
(Essay)
4.9/5 (38)
When the necessary conditions are met,a two-tail test is being conducted at α = .05 to test  .The two sample variances are
  and
and  ,and the sample sizes are n1 = 16and n2 = 25.The calculated value of the test statistic will be F = 0.33.
(True/False)
4.9/5 (36)
____________________ samples are those for which the selection process for one is not related to the selection process for the other.
(Short Answer)
4.9/5 (33)
The pooled proportion estimate is used when the null hypothesis states that the two population proportions differ by some non-zero number.
(True/False)
4.7/5 (23)
When the sample sizes are equal,the pooled variance of the two samples is the weighted average of the two sample variances.
(True/False)
4.9/5 (34)
Suppose we randomly selected 250 people,and on the basis of their responses to a survey we assigned them to one of two groups: high-risk group and low-risk group.We then recorded the blood pressure for the members of each group.Such data are called:
(Multiple Choice)
5.0/5 (39)
A required condition for using the normal approximation to the binomial in testing the difference between two population proportions is that n1p1 ≥ 30 and n2p2 ≥ 30.
(True/False)
4.8/5 (33)
Profit Margin
An investor is considering two types of investment.She is quite satisfied that the expected profit margin on Investment 1 is higher than the expected profit margin on Investment 2.However,she is quite concerned that the risk associated with Investment 1 is higher than that of Investment 2.To help make her decision,she randomly selects seven monthly profit margins on investment 1 and ten monthly profit margins on investment 2.She finds that the sample variances of Investments 1 and 2 are 225 and 118,respectively.
-{Profit Margin Narrative} Briefly describe what the interval estimate tells you.
(Essay)
5.0/5 (35)
In testing the difference between two population means for which the population variances are unknown and not assumed to be equal,two independent samples are drawn from the populations.Which of the following tests is appropriate?
(Multiple Choice)
5.0/5 (41)
Mass Production Line
A quality control examiner keeps a tally sheet of the number of acceptable and unacceptable products that come off two different production lines.The completed sheet is shown below. 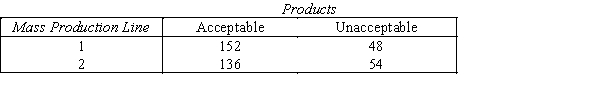
-{Mass Production Line Narrative} Can the inspector infer at the 5% significance level that production line 1 is doing a better job than production line 2?
-{Mass Production Line Narrative} Can the inspector infer at the 5% significance level that production line 1 is doing a better job than production line 2?
(Essay)
4.9/5 (38)
Mass Production Line
A quality control examiner keeps a tally sheet of the number of acceptable and unacceptable products that come off two different production lines.The completed sheet is shown below.
-{Mass Production Line Narrative} Estimate with 95% confidence the difference in population proportions.
(Essay)
4.9/5 (32)
We use a t-test to determine whether two population variances are equal.
(True/False)
4.9/5 (27)
The sampling distribution of the ratio of two sample variances  is said to be F-distributed provided that:
(Multiple Choice)
4.9/5 (39)
Headache Medicine
A researcher wants to see if/how men and women differ in their reaction to a headache medicine with respect to drowsiness.In testing the hypotheses  .the following statistics were obtained: n1 = 400,x1 = 208,n2 = 250,and x2 = 115,where x1 and x2 represent the number of patients in the two samples (men vs.women)who reported to have drowsiness as a result of taking headache medicine.
-{Headache Medicine Narrative} What conclusion can we draw at the 10% significance level?
.the following statistics were obtained: n1 = 400,x1 = 208,n2 = 250,and x2 = 115,where x1 and x2 represent the number of patients in the two samples (men vs.women)who reported to have drowsiness as a result of taking headache medicine.
-{Headache Medicine Narrative} What conclusion can we draw at the 10% significance level?
(Essay)
4.8/5 (34)
Motorcycle insurance appraisers examine motorcycles that have been involved in accidental collisions to assess the cost of repairs.An insurance executive is concerned that different appraisers produce significantly different assessments.In an experiment 10 motorcycles that have recently been involved in accidents were shown to two appraisers.Each assessed the estimated repair costs.These results are shown below.Can the executive conclude at the 5% significance level that the appraisers differ in their assessments? 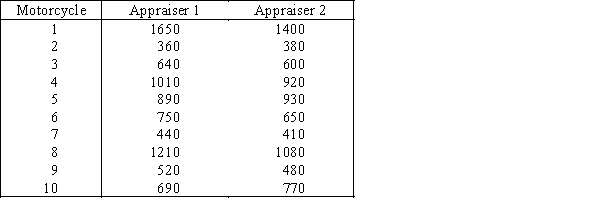
(Essay)
4.9/5 (35)
A political analyst in Hawaii surveys a random sample of registered Democrats and compares the results with those obtained from a random sample of registered Republicans.This would be an example of:
(Multiple Choice)
4.9/5 (37)
The sampling distribution of  is normal if the sampled populations are normal,and approximately normal if the populations are nonnormal and the sample sizes n1 and n2 are large.
(True/False)
4.9/5 (33)
The t-test for the difference between the means of two independent populations assumes that the respective:
(Multiple Choice)
4.9/5 (34)
Filters
- Essay(0)
- Multiple Choice(0)
- Short Answer(0)
- True False(0)
- Matching(0)