Exam 16: Analyzing and Forecasting Time-Series Data
Exam 1: The Where, why, and How of Data Collection167 Questions
Exam 2: Graphs,charts and Tablesdescribing Your Data138 Questions
Exam 3: Describing Data Using Numerical Measures130 Questions
Exam 4: Using Probability and Probability Distributions77 Questions
Exam 5: Discrete Probability Distributions119 Questions
Exam 6: Introduction to Continuous Probability Distributions90 Questions
Exam 7: Introduction to Sampling Distributions104 Questions
Exam 8: Estimating Single Population Parameters145 Questions
Exam 9: Introduction to Hypothesis Testing129 Questions
Exam 10: Estimation and Hypothesis Testing for Two Population Parameters97 Questions
Exam 11: Hypothesis Tests and Estimation for Population Variances71 Questions
Exam 12: Analysis of Variance137 Questions
Exam 13: Goodness-Of-Fit Tests and Contingency Analysis104 Questions
Exam 14: Introduction to Linear Regression and Correlation Analysis136 Questions
Exam 15: Multiple Regression Analysis and Model Building153 Questions
Exam 16: Analyzing and Forecasting Time-Series Data133 Questions
Exam 17: Introduction to Nonparametric Statistics104 Questions
Exam 18: Introduction to Quality and Statistical Process Control110 Questions
Exam 19: Introduction to Decision Analysis116 Questions
Select questions type
If time-series data exhibit a seasonal pattern,which of the following approaches could be used to compute season indexes?
(Multiple Choice)
4.9/5  (36)
(36)
The Wilson Company is interested in forecasting demand for its XG-667 product for quarter 13 based on 12 quarters of data.The following shows the data and the double exponential smoothing model results for periods 1-12 using alpha = 0.20 and beta = 0.40.  Based on this information,what is the difference between the forecast for period 13 using smoothing constants of alpha = 0.20 and beta = 0.40 and smoothing constants of alpha = 0.10 and beta = 0.30? (Assume that the starting values for period 0 are C = 745 and T = 32.)
(Multiple Choice)
4.9/5 (42)
A company has developed a linear trend regression model based on 16 quarters of data.The independent variable is the measure of time (t = 1 thru 16 where quarter 1 is winter quarter,2 is spring,etc.).The company has also developed seasonal indexes for each quarter as follows:  The linear trend forecast equation is:
  = 120 + 56t. Given this information,what is the seasonally unadjusted forecast for period 19?
(Multiple Choice)
4.8/5 (35)
Under which of the following conditions would you suggest that a double exponential smoothing model should be used instead of a single exponential smoothing model?
(Multiple Choice)
4.9/5 (34)
A company has recorded 12 months of sales data for the past year and has found the linear trend equation is  = 286 + 64.9t.Based on this information,which of the following is the forecast for period 13?
(Multiple Choice)
4.7/5 (35)
In a single exponential smoothing model,finding the forecast value for each period requires having the actual and forecast values from the proceeding period.This is not possible for the first period,so for the first period one should use the actual value as the forecast value.
(True/False)
4.9/5 (40)
Harrison Hollow,an upscale eatery in Atlanta,tracks its sales on a daily basis.Recently,the manager stated that sales over the past three weeks have been very cyclical.Given the data she has,this statement is not a reasonable one to make.
(True/False)
5.0/5 (39)
A seasonal index is a statistic that is computed from time-series data to indicate the effect of the seasonality in the time-series data.
(True/False)
4.8/5 (33)
The Durbin-Watson test for autocorrelation can be reliably applied to any sample sizes.
(True/False)
4.9/5 (35)
The Baker's Candy Company has been in business for three years.The quarterly sales data for the company are shown as follows:  As a first step in computing a seasonal index,the four-period moving average corresponding to the mid-point between periods 2 and 3 is 3,350.
(True/False)
4.8/5 (39)
The Baker's Candy Company has been in business for three years.The quarterly sales data for the company are shown as follows: 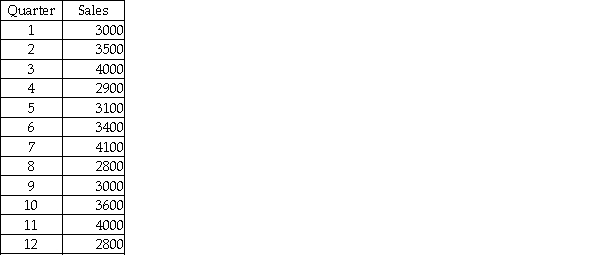 Based on these data,the seasonal index for quarters 3,7,and 11 is approximately 1.61.
(True/False)
5.0/5 (33)
To compare one value measured at one point in time with other values measured at different points in time,index numbers must be used.
(True/False)
4.9/5 (30)
The Wilson Company is interested in forecasting demand for its XG-667 product for quarter 13 based on 12 quarters of data.The following shows the data and the double exponential smoothing model results for periods 1-12 using alpha = 0.20 and beta = 0.40. 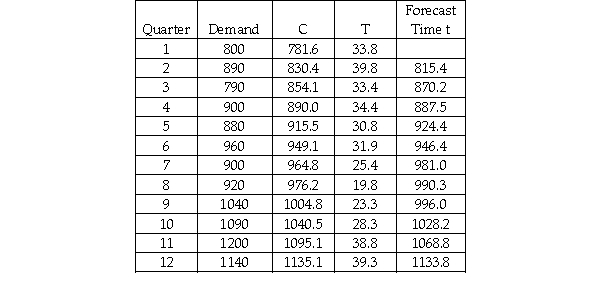 Based on this information,what is the MAD value for quarters 2-12?
(Multiple Choice)
4.9/5 (37)
Filters
- Essay(0)
- Multiple Choice(0)
- Short Answer(0)
- True False(0)
- Matching(0)