Exam 16: Analyzing and Forecasting Time-Series Data
Exam 1: The Where, why, and How of Data Collection167 Questions
Exam 2: Graphs,charts and Tablesdescribing Your Data138 Questions
Exam 3: Describing Data Using Numerical Measures130 Questions
Exam 4: Using Probability and Probability Distributions77 Questions
Exam 5: Discrete Probability Distributions119 Questions
Exam 6: Introduction to Continuous Probability Distributions90 Questions
Exam 7: Introduction to Sampling Distributions104 Questions
Exam 8: Estimating Single Population Parameters145 Questions
Exam 9: Introduction to Hypothesis Testing129 Questions
Exam 10: Estimation and Hypothesis Testing for Two Population Parameters97 Questions
Exam 11: Hypothesis Tests and Estimation for Population Variances71 Questions
Exam 12: Analysis of Variance137 Questions
Exam 13: Goodness-Of-Fit Tests and Contingency Analysis104 Questions
Exam 14: Introduction to Linear Regression and Correlation Analysis136 Questions
Exam 15: Multiple Regression Analysis and Model Building153 Questions
Exam 16: Analyzing and Forecasting Time-Series Data133 Questions
Exam 17: Introduction to Nonparametric Statistics104 Questions
Exam 18: Introduction to Quality and Statistical Process Control110 Questions
Exam 19: Introduction to Decision Analysis116 Questions
Select questions type
The Boxer Company has been in business since 1998.The following sales data are recorded by quarter for the years 1999-2001. 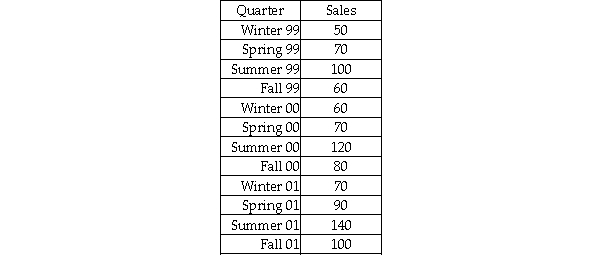 The managers at the company wish to determine the seasonal indexes for each quarter during the year.The first step in the process is to remove the seasonal and random components.To do this,they will begin by computing a four period moving average.What is the four-period moving average based on Winter 99 - Fall 99?
(Multiple Choice)
4.9/5  (39)
(39)
Model specification is the process of determining how well a forecasting model fits the past data.
(True/False)
4.8/5 (36)
A plot of the time series with time on the horizontal axis is an effective means of assessing whether the series is linear or nonlinear.
(True/False)
4.8/5 (29)
A time series is shown below.Perform single exponential smoothing for this data set using α = 0.2. 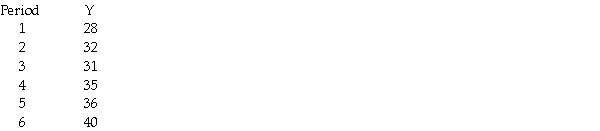 What is the value of the forecast for period 6?
(Multiple Choice)
4.9/5 (39)
Which of the following time-series components can be identified when a company has 12 weeks of data beginning January and extending through March?
(Multiple Choice)
5.0/5 (39)
In a double smoothing model,large values for the two smoothing constants will result in greater smoothing of the time series.
(True/False)
4.8/5 (31)
The Zocor Company is interested in forecasting period 13 sales for a product.It has 12 months of historical data.The following shows the data and the forecasted values for periods 1-12 using a single exponential smoothing model with a smoothing constant value equal to 0.20. 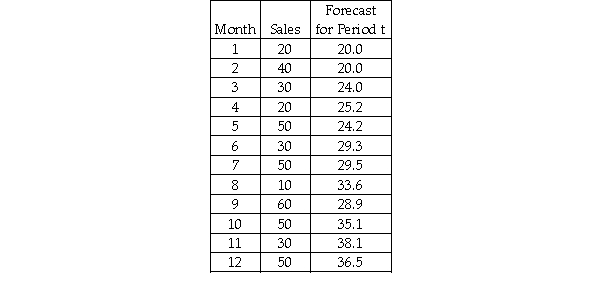 Which of the following would be the forecast for period 13?
(Multiple Choice)
4.8/5 (24)
One of the disadvantages of a regression-based linear trend forecasting model is that the forecast errors are computed for time periods that were used in developing the forecasting model and thus do not truly measure the forecasting ability of the model.
(True/False)
5.0/5 (37)
If the forecast errors are autocorrelated,this is a good indication that the model has been specified correctly.
(True/False)
4.9/5 (34)
A company has developed a linear trend model to forecast monthly sales.The following data show the actual sales and the "fitted" sales for months 1-12. 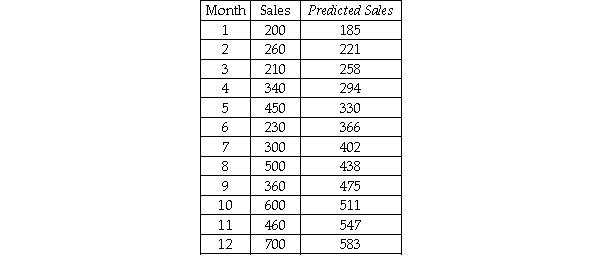 Based on these data,what is the value for the mean absolute deviation for months 1-12?
(Multiple Choice)
4.7/5 (36)
If the Durbin-Watson d statistic has a value close to 2,there is reason to believe that there is no autocorrelation between the forecast errors.
(True/False)
4.8/5 (28)
In a simple exponential smoothing model,which of the following statements is true?
(Multiple Choice)
4.7/5 (36)
The Wilson Company is interested in forecasting demand for its XG-667 product for quarter 13 based on 12 quarters of data.The following shows the data and the double exponential smoothing model results for periods 1-12 using alpha = 0.20 and beta = 0.40. 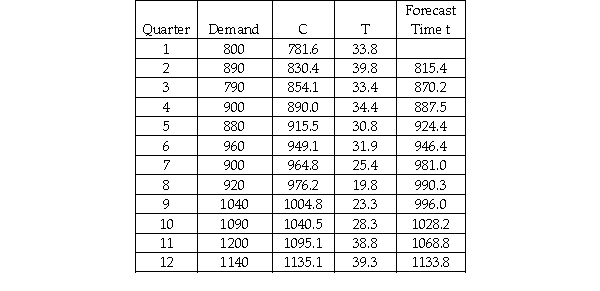 Based on this information,which of the following statements is true?
(Multiple Choice)
4.9/5 (28)
The most useful tool to identify the trend component of a time series is
(Multiple Choice)
4.8/5 (38)
Which of the following time-series components is almost always present in sales data for electronics companies?
(Multiple Choice)
4.8/5 (26)
A time-series plot that exhibits a general increase in value from the early periods to the latest time periods:
(Multiple Choice)
4.7/5 (26)
Renton Industries makes replacement parts for the automobile industry.As part of the company's capacity planning,it needs a long-range total demand forecast.The following information was generated based on 10 years of historical data on total number of parts sold each year. 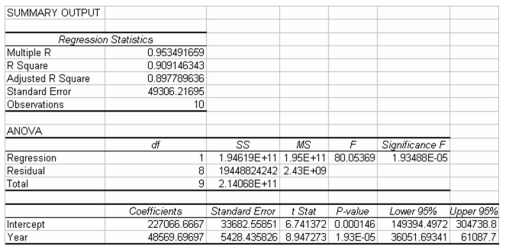 Based on this information,the percent of variation in the number of parts sold that is explained by the linear trend model is approximately 90.9.
(True/False)
4.8/5 (32)
The Boxer Company has been in business since 1998.The following sales data are recorded by quarter for the years 1999-2001.  Which of the following time-series components are present in these data?
(Multiple Choice)
4.8/5 (36)
Filters
- Essay(0)
- Multiple Choice(0)
- Short Answer(0)
- True False(0)
- Matching(0)