Exam 16: Analyzing and Forecasting Time-Series Data
Exam 1: The Where, why, and How of Data Collection167 Questions
Exam 2: Graphs,charts and Tablesdescribing Your Data138 Questions
Exam 3: Describing Data Using Numerical Measures130 Questions
Exam 4: Using Probability and Probability Distributions77 Questions
Exam 5: Discrete Probability Distributions119 Questions
Exam 6: Introduction to Continuous Probability Distributions90 Questions
Exam 7: Introduction to Sampling Distributions104 Questions
Exam 8: Estimating Single Population Parameters145 Questions
Exam 9: Introduction to Hypothesis Testing129 Questions
Exam 10: Estimation and Hypothesis Testing for Two Population Parameters97 Questions
Exam 11: Hypothesis Tests and Estimation for Population Variances71 Questions
Exam 12: Analysis of Variance137 Questions
Exam 13: Goodness-Of-Fit Tests and Contingency Analysis104 Questions
Exam 14: Introduction to Linear Regression and Correlation Analysis136 Questions
Exam 15: Multiple Regression Analysis and Model Building153 Questions
Exam 16: Analyzing and Forecasting Time-Series Data133 Questions
Exam 17: Introduction to Nonparametric Statistics104 Questions
Exam 18: Introduction to Quality and Statistical Process Control110 Questions
Exam 19: Introduction to Decision Analysis116 Questions
Select questions type
The Baker's Candy Company has been in business for three years.The quarterly sales data for the company are shown as follows: 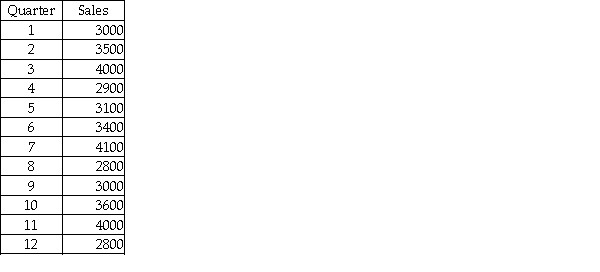 Based on this information,the data reflect both a linear trend and seasonal components.
(True/False)
4.8/5  (37)
(37)
Some stocks are referred to as cyclical stock because they tend to be in favor for several years and then out of favor for several years.This is a correct use of the term cyclical.
(True/False)
4.9/5 (43)
The forecasting interval is the unit of time for which forecasts are made.
(True/False)
4.8/5 (43)
While virtually all time series exhibit a random component,not all time series exhibit other components.
(True/False)
4.8/5 (35)
A company has recorded the 12 months of sales data for the past year.It wishes to use the regression approach to develop a trend-based approach for forecasting future months.The following data are provided: 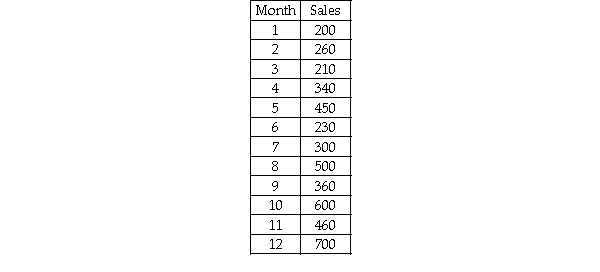 Based on this information,which of the following is forecast for month 15?
(Multiple Choice)
4.9/5 (39)
A seasonally unadjusted forecast is one that is made from seasonal data without any adjustment for the seasonal component in the time series.
(True/False)
4.7/5 (32)
In a recent meeting,the marketing manager for a large hardware company stated that he needed to have a forecast prepared for the next three months.The three-month period is called:
(Multiple Choice)
4.9/5 (32)
Suppose an economist has developed a model for forecasting annual consumption,yt,as function of total labor income,x1t,and total property income,x2t based on 20 years on annual data.The following regression model has been developed:  = 7.81 + 0.91x1t + 0.57x2t with the standard error = 1.29 and the Durbin-Watson d statistic = 2.09.Using an alpha = .05,which of the following is the correct critical value for testing whether the residuals are autocorrelated?
(Multiple Choice)
4.8/5 (33)
The reason for testing for the presence of autocorrelation in a regression-based trend forecasting model is that one assumption of the regression analysis is that the residuals are not correlated.
(True/False)
4.8/5 (33)
If the Durbin-Watson test leads you to reject the null hypothesis,then you are concluding that the forecast errors are positively autocorrelated.
(True/False)
4.8/5 (33)
Which of the following approaches might be used to determine which value for the smoothing constant to use in a single exponential smoothing model?
(Multiple Choice)
4.8/5 (36)
If a manager is planning for an expansion of the factory,a forecast model with a long-term planning horizon would probably be used.
(True/False)
4.8/5 (36)
In a double smoothing model,the second smoothing constant is introduced to account for the trend in the data if one exists.
(True/False)
4.9/5 (33)
If a forecasting model produces forecast errors (residuals)that are negatively correlated,then we expect a negative residual to be followed by another negative residual to be followed by another negative residual and so forth.
(True/False)
4.8/5 (35)
One of the basic tools for creating a trend-based forecasting model is regression analysis.
(True/False)
4.9/5 (44)
In a time series with quarterly sales data,assume that the seasonal index for the summer quarter has been found to be 0.87,this can be interpreted to mean that sales tend to be 87 percent higher in the summer quarter when compared to the other quarters.
(True/False)
4.8/5 (30)
The Morgan Company is interested in developing a forecast for next month's sales.It has collected sales data for the past 12 months. 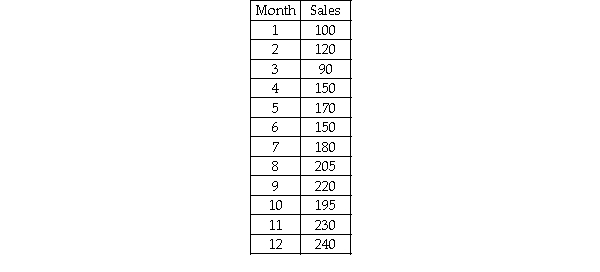 After analyzing these data,if the company wishes to use exponential smoothing with alpha = 0.20 and beta = 0.20,the starting values for the constant process and the trend process can be derived from a linear trend regression model by using the intercept and slope coefficient respectively.
(True/False)
4.9/5 (36)
Renton Industries makes replacement parts for the automobile industry.As part of the company's capacity planning,it needs a long-range total demand forecast.The following information was generated based on 10 years of historical data on total number of parts sold each year. 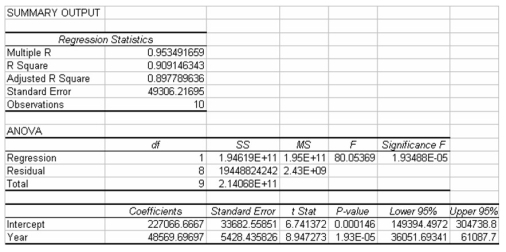 Based on this information we can conclude that the linear trend model explains a significant proportion of the variation in the number of parts sold,because the p-value is much smaller than any reasonable α that we might use.
(True/False)
4.7/5 (39)
Given the following time series data:  and using smoothing constants of alpha = 0.3,the exponential smoothing forecast for time period 3 is
(Multiple Choice)
4.9/5 (39)
Filters
- Essay(0)
- Multiple Choice(0)
- Short Answer(0)
- True False(0)
- Matching(0)