Exam 16: Analyzing and Forecasting Time-Series Data
Exam 1: The Where, why, and How of Data Collection167 Questions
Exam 2: Graphs,charts and Tablesdescribing Your Data138 Questions
Exam 3: Describing Data Using Numerical Measures130 Questions
Exam 4: Using Probability and Probability Distributions77 Questions
Exam 5: Discrete Probability Distributions119 Questions
Exam 6: Introduction to Continuous Probability Distributions90 Questions
Exam 7: Introduction to Sampling Distributions104 Questions
Exam 8: Estimating Single Population Parameters145 Questions
Exam 9: Introduction to Hypothesis Testing129 Questions
Exam 10: Estimation and Hypothesis Testing for Two Population Parameters97 Questions
Exam 11: Hypothesis Tests and Estimation for Population Variances71 Questions
Exam 12: Analysis of Variance137 Questions
Exam 13: Goodness-Of-Fit Tests and Contingency Analysis104 Questions
Exam 14: Introduction to Linear Regression and Correlation Analysis136 Questions
Exam 15: Multiple Regression Analysis and Model Building153 Questions
Exam 16: Analyzing and Forecasting Time-Series Data133 Questions
Exam 17: Introduction to Nonparametric Statistics104 Questions
Exam 18: Introduction to Quality and Statistical Process Control110 Questions
Exam 19: Introduction to Decision Analysis116 Questions
Select questions type
Suppose an economist has developed a model for forecasting annual consumption,yt ,as function of total labor income,x1t ,and total property income,x2t based on 20 years on annual data.The following regression model has been developed:  = 7.81 + 0.91x1t + 0.57x2t with the standard error = 1.29 and the Durbin-Watson d statistic = 2.09.Using an alpha = .05,which of the following conclusions should be reached?
(Multiple Choice)
4.8/5  (39)
(39)
Forecast bias measures the average amount of error per forecast,so a positive value means that forecasts tended to be too low.
(True/False)
4.8/5 (27)
Which of the following is true about index numbers? Index numbers are:
(Multiple Choice)
4.8/5 (33)
A company's annual sales are shown below in thousands of dollars for a period of 10 years. 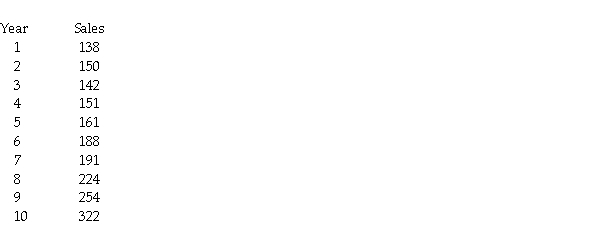 Plot the time series; find the linear regression model,and also the forecast value and error for each of the years.Also discuss whether you think a linear model appears to be appropriate.
(Essay)
5.0/5 (46)
If the historical data on which the model is being built consist of weekly data,the forecasting period would also be weekly.
(True/False)
4.9/5 (39)
Because simple exponential smoothing models require a starting point for the first period forecast that will be arbitrary,it is important to have as much data as possible to dampen out the effect of the starting point.
(True/False)
4.7/5 (39)
It is possible to conduct a statistical test for autocorrelation using the Durbin-Watson test and not be able to make a definitive conclusion about whether there is autocorrelation or not based on the data.
(True/False)
4.9/5 (41)
From an annual time series of a company's sales the linear trend model Ft = 127 + 54(t)has been developed.This means that on average sales have been increasing by 127 per year.
(True/False)
4.8/5 (36)
In a single exponential smoothing model,a large value for the smoothing constant will result in greater smoothing of the data than will a smoothing constant close to zero.
(True/False)
4.8/5 (42)
A time-series graph shows that annual sales data have grown gradually over the past 10 years.Given this,if a linear trend model is used to forecast future years' sales,the sign on the regression slope coefficient will be positive.
(True/False)
4.9/5 (44)
After a linear forecasting model is found for a time series,if the Durbin-Watson statistic is less than dL this means that:
(Multiple Choice)
4.8/5 (40)
Stock analysts have recently stated in a meeting on Wall Street that over the past 50 years there have been periods of high market prices followed by periods of lower prices but over time prices have moved upwards.Given their statement,stock prices most likely exhibit only trend and cyclical components.
(True/False)
4.8/5 (27)
The All American Toy Company has a very seasonal sales pattern.Sales are high during the fall quarter,drop off substantially in the winter quarter and are more typical during spring and summer quarters.The following historical data exist for the past 16 quarters. 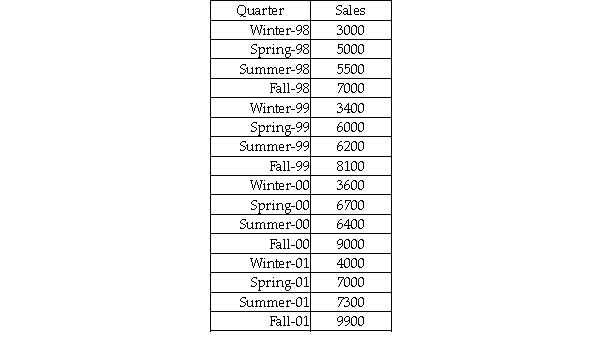 Based on these data,develop a seasonally adjusted forecast for the four quarters of 2002 using a linear trend regression model.
(Essay)
4.8/5 (35)
Gibson,Inc.is a holding company that owns several businesses.One such business is a truck sales company.To help in managing this operation,managers at Gibson have collected sales data for the past 20 years showing the number of trucks sold each year.They have then developed the linear trend forecasting model shown as ollows: 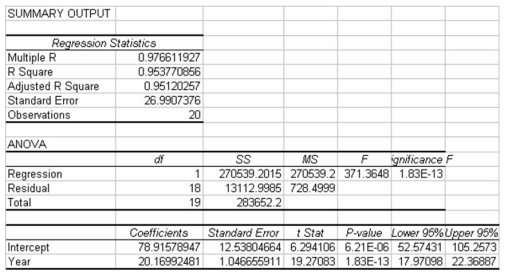 Based on this information,the fitted value for year 1 is about 99.
(True/False)
4.7/5 (36)
If a time-series plot indicates that the data do not appear to exhibit a trend,then a double exponential smoothing model would likely be the most appropriate to use rather than simple exponential smoothing model.
(True/False)
4.9/5 (36)
In a recent meeting,a manager indicated that sales tend to be higher during October,November,and December and lower in the spring.In making this statement,she is indicating that sales for the company are cyclical.
(True/False)
4.8/5 (42)
In comparing two or more forecasting models,the MAD value is useful in determining how successful the models were in fitting historical data.
(True/False)
4.8/5 (31)
The owners of Hal's Cookie Company have collected sales data for the past 8 months.These data are shown as follows:  Using a smoothing constant of 0.4,the forecast value for period 3 is 112.
(True/False)
4.8/5 (35)
A stockbroker at a large brokerage firm recently analyzed the combined annual profits for all firms in the airline industry.One time-series component that may have been present in these annual data was a seasonal component.
(True/False)
4.8/5 (39)
If a smoothing model is applied with a smoothing constant exceeding 0.50,the forecasting bias will tend to be positive in most cases.
(True/False)
4.8/5 (35)
Filters
- Essay(0)
- Multiple Choice(0)
- Short Answer(0)
- True False(0)
- Matching(0)