Exam 2: Tabular and Graphical Methods
Exam 1: Statistics and Data102 Questions
Exam 2: Tabular and Graphical Methods123 Questions
Exam 3: Numerical Descriptive Measures152 Questions
Exam 4: Introduction to Probability148 Questions
Exam 5: Discrete Probability Distributions158 Questions
Exam 6: Continuous Probability Distributions143 Questions
Exam 7: Sampling and Sampling Distributions136 Questions
Exam 8: Interval Estimation131 Questions
Exam 9: Hypothesis Testing116 Questions
Exam 10: Statistical Inference Concerning Two Populations131 Questions
Exam 11: Statistical Inference Concerning Variance120 Questions
Exam 12: Chi-Square Tests120 Questions
Exam 13: Analysis of Variance120 Questions
Exam 14: Regression Analysis140 Questions
Exam 15: Inference With Regression Models125 Questions
Exam 16: Regression Models for Nonlinear Relationships118 Questions
Exam 17: Regression Models With Dummy Variables130 Questions
Exam 18: Time Series and Forecasting125 Questions
Exam 19: Returns, Index Numbers, and Inflation120 Questions
Exam 20: Nonparametric Tests120 Questions
Select questions type
In order to summarize qualitative data, a useful tool is a ________.
(Multiple Choice)
4.9/5  (34)
(34)
A ________ ________ is a table that shows the number of data observations that fall into specific interval.
(Short Answer)
4.9/5 (31)
What graphical tool is best used to display the relative frequency of grouped quantitative data?
(Multiple Choice)
4.8/5 (34)
A car dealership created a scatterplot showing the manufacturer's retail price and profit margin for the cars they have on their lot. 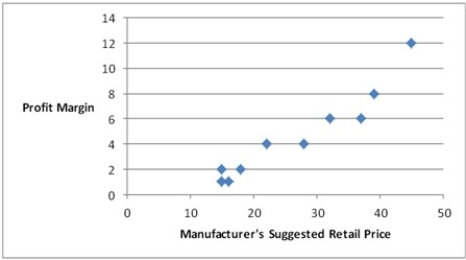 As the manufacturer's suggested retail price increases, the profit margin tends to ________.
(Multiple Choice)
4.9/5 (38)
Thirty students at Eastside High School took the SAT on the same Saturday. Their raw scores are given next.  (See the Excel Data File.) Consider a frequency distribution of the data that groups the data in classes of 1400 up to 1600, 1600 up to 1800, 1800 up to 2000, and so on. What is the approximate relative frequency of students who scored more than 1600 but less than 1800?
(Multiple Choice)
4.9/5 (37)
The following table shows the number of payroll jobs the government added during the years it added jobs (since 1973). The jobs are in thousands.  Approximately what percent of the time did the government add 200,000 or more jobs?
(Multiple Choice)
4.9/5 (28)
The accompanying relative frequency distribution represents the last year car sales for the sales force at Kelly's Mega Used Car Center.  If Kelly's employs 100 salespeople, how many of these salespeople have sold at least 65 cars in the last year?
(Multiple Choice)
4.9/5 (41)
In the accompanying stem-and-leaf diagram, the values in the stem-and-leaf portions represent 10s and 1s digits, respectively.  The stem-and-leaf diagram shows that the distribution is ________.
(Multiple Choice)
4.8/5 (30)
A high school football league recorded the average points scored per game, as well as the winning percentage, for the 10 teams in the league.  (See the Excel Data File.)
Construct a scatterplot. Does scoring more points appear to be associated with a higher winning percentage?
(See the Excel Data File.)
Construct a scatterplot. Does scoring more points appear to be associated with a higher winning percentage?
(Essay)
4.7/5 (31)
Scatterplot is a graphical tool that is focused on describing one variable.
(True/False)
4.9/5 (36)
Which of the following is not a graphical technique to display quantitative data?
(Multiple Choice)
4.9/5 (33)
The percent frequency of a category equals the frequency of the category multiplied by 100%.
(True/False)
4.9/5 (45)
Consider the following frequency distribution.  What proportion of the observations are at least 15 but less than 18?
(Multiple Choice)
4.8/5 (38)
The following data represent the ages of patients in the cardiac section of the local hospital. Construct a stem-and-leaf diagram. Comment on whether or not the distribution is symmetric.  (See the Excel Data File.)
(Essay)
4.7/5 (38)
The following stem-and-leaf diagram shows the speeds in miles per hour (mph) of 14 cars approaching a toll booth on a bridge in Oakland, California.  How many of the cars were traveling faster than 25 mph but slower than 40 mph?
(Multiple Choice)
4.8/5 (32)
Consider the following frequency distribution.  The total number of observations in the frequency distribution is ________.
(Multiple Choice)
4.7/5 (38)
In the accompanying stem-and-leaf diagram, the values in the stem-and-leaf portions represent 10s and 1s digits, respectively.  Find the frequency associated with data values that are more than 28.
(Multiple Choice)
4.9/5 (28)
Students in Professor Smith's business statistics course have evaluated the overall effectiveness of the professor's instruction on a five-point scale, where a score of 1 indicates very poor performance and a score of 5 indicates outstanding performance. The raw scores are displayed in the accompanying table:  (See the Excel Data File.) What is the relative frequency of the students who gave Professor Smith an evaluation of 3?
(Multiple Choice)
4.8/5 (29)
In the accompanying stem-and-leaf diagram, the values in the stem and leaf portions represent 10s and 1s digits, respectively.  Which of the following numbers appears in the stem-and-leaf diagram?
(Multiple Choice)
4.8/5 (40)
The Statistical Abstract of the United States provided the following frequency distribution of the number of people who live below the poverty level by region. 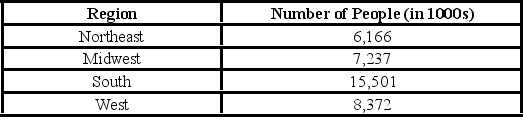 What is the percentage of people who live below the poverty level in the West or Midwest?
(Multiple Choice)
4.7/5 (41)
Filters
- Essay(0)
- Multiple Choice(0)
- Short Answer(0)
- True False(0)
- Matching(0)