Exam 2: Tabular and Graphical Methods
Exam 1: Statistics and Data102 Questions
Exam 2: Tabular and Graphical Methods123 Questions
Exam 3: Numerical Descriptive Measures152 Questions
Exam 4: Introduction to Probability148 Questions
Exam 5: Discrete Probability Distributions158 Questions
Exam 6: Continuous Probability Distributions143 Questions
Exam 7: Sampling and Sampling Distributions136 Questions
Exam 8: Interval Estimation131 Questions
Exam 9: Hypothesis Testing116 Questions
Exam 10: Statistical Inference Concerning Two Populations131 Questions
Exam 11: Statistical Inference Concerning Variance120 Questions
Exam 12: Chi-Square Tests120 Questions
Exam 13: Analysis of Variance120 Questions
Exam 14: Regression Analysis140 Questions
Exam 15: Inference With Regression Models125 Questions
Exam 16: Regression Models for Nonlinear Relationships118 Questions
Exam 17: Regression Models With Dummy Variables130 Questions
Exam 18: Time Series and Forecasting125 Questions
Exam 19: Returns, Index Numbers, and Inflation120 Questions
Exam 20: Nonparametric Tests120 Questions
Select questions type
The following stem-and-leaf diagram shows the last 20 dividend payments (in cents) paid by Procter and Gamble.  The most common dividend payment is ________.
(Multiple Choice)
4.8/5  (42)
(42)
A stem-and-leaf diagram is constructed by separating each value of a data set into two parts. What are these parts?
(Multiple Choice)
5.0/5 (28)
The following frequency distribution shows the frequency of the asking price, in thousands of dollars, for current homes on the market in a particular city. 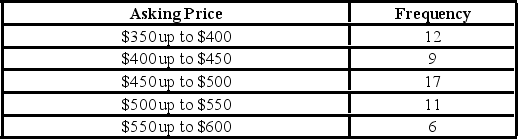 What percentage of houses has an asking price between $350,000 and under $400,000?
(Multiple Choice)
4.8/5 (35)
Consider the following frequency distribution.  How many observations are at least 15 but less than 18?
(Multiple Choice)
4.8/5 (30)
An analyst constructed the following frequency distribution on the monthly returns for 50 selected stocks:  The proportion of stocks with returns of 0% up to 10% is ________.
(Multiple Choice)
4.9/5 (36)
Consider the following frequency distribution.  What proportion of the observations are less than 21?
(Multiple Choice)
4.9/5 (34)
The manager at a water park constructed the following frequency distribution to summarize attendance in July and August. 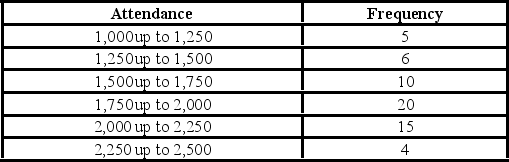 What of the following is the most likely attendance range?
(Multiple Choice)
4.7/5 (43)
The following histogram represents the number of pages in each book within a collection. What is the frequency of books containing at least 200 but fewer than 250 pages? 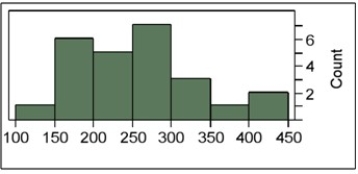
(Multiple Choice)
4.7/5 (36)
Graphically, we can show a(n) ________ ________ for qualitative data by constructing a pie chart or a bar chart.
(Short Answer)
4.7/5 (40)
The accompanying relative frequency distribution represents the last year car sales for the sales force at Kelly's Mega Used Car Center.  If Kelly's employs 100 salespeople, how many of these salespeople have sold at least 35 but fewer than 45 cars in the last year?
(Multiple Choice)
4.8/5 (33)
Recent home sales in a suburb of Washington, D.C., are shown in the accompanying ogive. 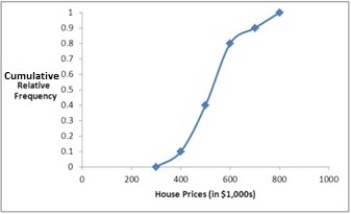 Approximate the percentage of houses that sold for more than $500,000.
(Multiple Choice)
4.9/5 (39)
The following table displays the top 40 American League batting averages of the last season.  (See the Excel Data File.)
A) Construct frequency, relative frequency, and cumulative relative frequency distributions that group the data in classes of 0.265 up to 0.280, 0.280 up to 0.295, 0.295 up to 0.310, and so on.
B) How many of these players have a batting average above 0.340? What proportion of these players has a batting average of at least 0.280 but below 0.295? What percentage of these players has a batting average below 0.325?
C) Construct a relative frequency histogram. Is the distribution symmetric? If not, is it positively or negatively skewed?
D) Construct an ogive.
E) Using the ogive, approximately what proportion of the players in this group has a batting average above 0.290?
(See the Excel Data File.)
A) Construct frequency, relative frequency, and cumulative relative frequency distributions that group the data in classes of 0.265 up to 0.280, 0.280 up to 0.295, 0.295 up to 0.310, and so on.
B) How many of these players have a batting average above 0.340? What proportion of these players has a batting average of at least 0.280 but below 0.295? What percentage of these players has a batting average below 0.325?
C) Construct a relative frequency histogram. Is the distribution symmetric? If not, is it positively or negatively skewed?
D) Construct an ogive.
E) Using the ogive, approximately what proportion of the players in this group has a batting average above 0.290?
(Essay)
4.8/5 (43)
The following table lists some of the busiest ports in the world based on the number of containers in Year 1.  Construct a pie chart to summarize the data. Approximately what percent of the total number of containers go through Hong Kong?
(Essay)
4.9/5 (35)
The following is a list of five of the world's busiest airports by passenger traffic for Year 1.  The percentage of passenger traffic in the five busiest airports that occurred in Asia is the closest to ________.
(Multiple Choice)
4.9/5 (26)
A city in California spent $6 million repairing damage to its public buildings in Year 1. The following table shows the categories where the money was directed. 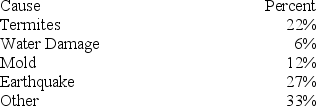 How much did the city spend to fix damage caused by mold?
(Multiple Choice)
4.7/5 (36)
The accompanying table shows students' scores from the final exam in a history course. 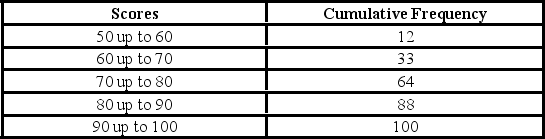 How many of the students scored at least 70 but less than 90?
(Multiple Choice)
4.8/5 (34)
When constructing a frequency distribution for quantitative data, it is important to remember that ________.
(Multiple Choice)
4.8/5 (39)
Filters
- Essay(0)
- Multiple Choice(0)
- Short Answer(0)
- True False(0)
- Matching(0)