Exam 2: Tabular and Graphical Methods
Exam 1: Statistics and Data102 Questions
Exam 2: Tabular and Graphical Methods123 Questions
Exam 3: Numerical Descriptive Measures152 Questions
Exam 4: Introduction to Probability148 Questions
Exam 5: Discrete Probability Distributions158 Questions
Exam 6: Continuous Probability Distributions143 Questions
Exam 7: Sampling and Sampling Distributions136 Questions
Exam 8: Interval Estimation131 Questions
Exam 9: Hypothesis Testing116 Questions
Exam 10: Statistical Inference Concerning Two Populations131 Questions
Exam 11: Statistical Inference Concerning Variance120 Questions
Exam 12: Chi-Square Tests120 Questions
Exam 13: Analysis of Variance120 Questions
Exam 14: Regression Analysis140 Questions
Exam 15: Inference With Regression Models125 Questions
Exam 16: Regression Models for Nonlinear Relationships118 Questions
Exam 17: Regression Models With Dummy Variables130 Questions
Exam 18: Time Series and Forecasting125 Questions
Exam 19: Returns, Index Numbers, and Inflation120 Questions
Exam 20: Nonparametric Tests120 Questions
Select questions type
In the accompanying stem-and-leaf diagram, the values in the stem-and-leaf portions represent 10s and 1s digits, respectively.  How many values are at least 25 but less than 35?
(Multiple Choice)
4.9/5  (30)
(30)
What type of relationship is indicated in the scatterplot? 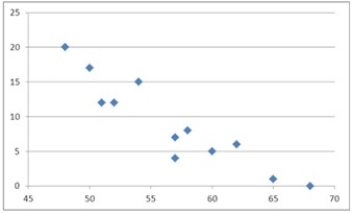
(Multiple Choice)
5.0/5 (40)
Consider the following frequency distribution.  How many observations are less than 21?
(Multiple Choice)
4.9/5 (43)
The following data represent scores on a pop quiz in a statistics section.  (See the Excel Data File.) Suppose the data are grouped into five classes, and one of them will be "30 up to 44"-that is, {x; 30 ≤ x < 44}. The relative frequency of this class is ________.
(Multiple Choice)
4.7/5 (37)
The dividend yields of the stocks in an investor's portfolio are shown in the following cumulative relative frequency distribution.  a. Construct an ogive.
B) Approximately what percent of the stocks had a dividend yield of 3% or larger?
a. Construct an ogive.
B) Approximately what percent of the stocks had a dividend yield of 3% or larger?
(Essay)
4.9/5 (39)
Automobiles traveling on a road with a posted speed limit of 65 miles per hour are checked for speed by a state police radar system. The following table is a frequency distribution of speeds. 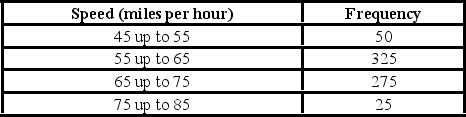 How many of the cars traveled less than 75 miles per hour?
(Multiple Choice)
4.8/5 (34)
The relative frequency of a category is calculated by dividing the category's frequency by the total number of observations.
(True/False)
4.9/5 (34)
For qualitative data, a frequency distribution groups data into ________ and records the number of ________.
(Short Answer)
4.9/5 (44)
The shape of most data distributions can be categorized as either ________ or ________.
(Short Answer)
4.9/5 (44)
A pie chart is a segmented circle that portrays the categories and relative sizes of some quantitative variable.
(True/False)
4.8/5 (42)
Each month the Bureau of Labor Statistics reports the number of people (in thousands) employed in the United States by age. The accompanying frequency distribution shows the results for August. 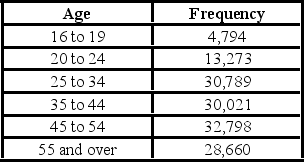 a. Construct a relative frequency distribution. What proportion of workers is between 20 and 24 years old?
B) Construct a cumulative relative frequency distribution. What proportion of workers is younger than 35 years old?
C) Construct a relative frequency histogram.
a. Construct a relative frequency distribution. What proportion of workers is between 20 and 24 years old?
B) Construct a cumulative relative frequency distribution. What proportion of workers is younger than 35 years old?
C) Construct a relative frequency histogram.
(Essay)
4.8/5 (33)
Automobiles traveling on a road with a posted speed limit of 65 miles per hour are checked for speed by a state police radar system. The following table is a frequency distribution of speeds.  What proportion of the cars traveled at least 55 but less than 65 miles per hour?
(Multiple Choice)
4.8/5 (33)
A polygon connects a series of neighboring points where each point represents the midpoint of a particular class and its associated frequency or relative frequency.
(True/False)
5.0/5 (38)
The statistics professor has kept attendance records and recorded the number of absent students per class. The recorded data is displayed in the following bar chart with the frequency of each number of absent students shown above the bars. 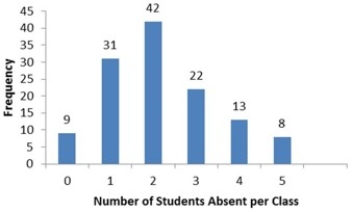 How many statistics classes had three or more students absent?
(Multiple Choice)
4.8/5 (29)
An auto parts chain asked customers to complete a survey rating the chain's customer service as average, above average, or below average. The following shows the results from the survey:  (See the Excel Data File.) The proportion of customers who felt the customer service was Average is the closest to ________.
(Multiple Choice)
4.8/5 (34)
Use the following data to construct a scatterplot. What type of relationship is implied?  (See the Excel Data File.)
(Multiple Choice)
4.8/5 (37)
The following data represent scores on a pop quiz in a statistics section:  (See the Excel Data File.)e Suppose the data are grouped into five classes, and one of them will be "30 up to 44"-that is, {x; 30 ≤ x < 44}. The frequency of this class is ________.
(Multiple Choice)
4.7/5 (34)
The organization of the Girl Sprouts has completed its annual cookie drive. The sales are reported in the accompanying ogive. 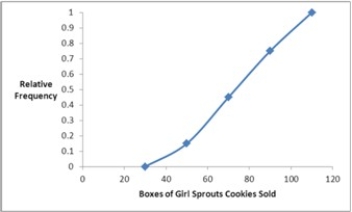 Approximate the percentage of girls who sold more than 70 boxes of cookies.
(Multiple Choice)
4.9/5 (34)
The following histogram represents the number of pages in each book within a collection. What is the frequency of books containing at least 250 but fewer than 400 pages? 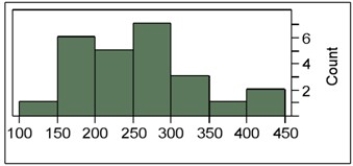
(Multiple Choice)
4.7/5 (33)
Frequency distributions may be used to describe which of the following types of data?
(Multiple Choice)
4.8/5 (27)
Filters
- Essay(0)
- Multiple Choice(0)
- Short Answer(0)
- True False(0)
- Matching(0)