Exam 15: Inference With Regression Models
Exam 1: Statistics and Data102 Questions
Exam 2: Tabular and Graphical Methods123 Questions
Exam 3: Numerical Descriptive Measures152 Questions
Exam 4: Introduction to Probability148 Questions
Exam 5: Discrete Probability Distributions158 Questions
Exam 6: Continuous Probability Distributions143 Questions
Exam 7: Sampling and Sampling Distributions136 Questions
Exam 8: Interval Estimation131 Questions
Exam 9: Hypothesis Testing116 Questions
Exam 10: Statistical Inference Concerning Two Populations131 Questions
Exam 11: Statistical Inference Concerning Variance120 Questions
Exam 12: Chi-Square Tests120 Questions
Exam 13: Analysis of Variance120 Questions
Exam 14: Regression Analysis140 Questions
Exam 15: Inference With Regression Models125 Questions
Exam 16: Regression Models for Nonlinear Relationships118 Questions
Exam 17: Regression Models With Dummy Variables130 Questions
Exam 18: Time Series and Forecasting125 Questions
Exam 19: Returns, Index Numbers, and Inflation120 Questions
Exam 20: Nonparametric Tests120 Questions
Select questions type
________ plots can be used to detect common violations, and they can be used to detect outliers.
(Short Answer)
4.7/5  (37)
(37)
The accompanying table shows the regression results when estimating y = β0 + β1x1 + β2x2 + β3x3 + ε.  a. Specify the competing hypotheses to determine whether the explanatory variables are jointly significant.
B) At the 5% significance level, are the explanatory variables jointly significant? Explain.
C) At the 5% significance level, is x2 significant in explaining y? Explain.
D) At the 5% significance level, is the slope coefficient attached to x3 different from −2?
a. Specify the competing hypotheses to determine whether the explanatory variables are jointly significant.
B) At the 5% significance level, are the explanatory variables jointly significant? Explain.
C) At the 5% significance level, is x2 significant in explaining y? Explain.
D) At the 5% significance level, is the slope coefficient attached to x3 different from −2?
(Essay)
4.7/5 (38)
In regression, multicollinearity is considered problematic when two or more explanatory variables are ________.
(Multiple Choice)
4.8/5 (37)
If in the multiple linear model the slope coefficient βi is negative, it suggests an inverse (negative) relationship between the explanatory variable xi and the response variable y holding the other explanatory variables constant.
(True/False)
4.8/5 (37)
An economist estimates the following model: y = β0 + β1x + ε. She would like to construct interval estimates for y when x equals 2. She estimates a modified model where y is the response variable and the explanatory variable is now defined as x* = x - 2. A portion of the regression results is shown in the accompanying table. 
 According to the modified model, which of the following is a 95% prediction interval for y when x equals 2? (Note that t0.025,10 = 2.228.)
(Multiple Choice)
4.8/5 (41)
With the partial F test, we basically analyze the ratio of (SSER - SSEU) to ________.
(Short Answer)
4.8/5 (45)
If the variance of the error term is not the same for all observations, we ________.
(Multiple Choice)
4.8/5 (33)
A sports analyst wants to exam the factors that may influence a tennis player's chances of winning. Over four tournaments, he collects data on 30 tennis players and estimates the following model: Win = β0 + β1Double Faults + β2Aces + ε, where Win is the proportion of winning, Double Faults is the percentage of double faults made, and Aces is the number of aces. A portion of the regression results are shown in the accompanying table. 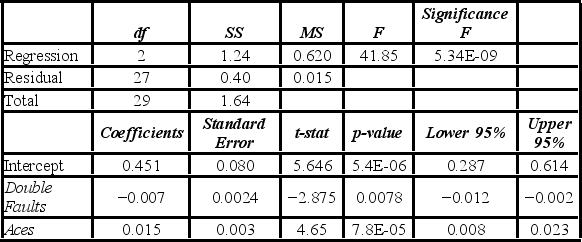 When testing whether the explanatory variables jointly influence the response variable, the null hypothesis is ________.
(Multiple Choice)
4.8/5 (32)
Excel and virtually all other statistical packages report the p-value ________.
(Multiple Choice)
5.0/5 (40)
A sociologist estimates the regression relating Poverty (y) to Education (x1). The estimated regression equation is:  = 71.68 - 0.69x1; n = 39; SSE = 152.
In an attempt to improve the results, he adds two more explanatory variables: Median Income (x2, in $1,000s) and the Mortality Rate (x3, per 1,000 residents). The estimated regression equation is:
= 71.68 - 0.69x1; n = 39; SSE = 152.
In an attempt to improve the results, he adds two more explanatory variables: Median Income (x2, in $1,000s) and the Mortality Rate (x3, per 1,000 residents). The estimated regression equation is:  = 59.80 - 0.44x1- 0.18x2 + 0.17x3; n = 39; SSE = 60.
A) Formulate the hypotheses to determine whether Median Income and the Mortality Rate are jointly significant in explaining Poverty.
B) Calculate the value of the test statistic.
C) At the 5% significance level, find the approximate value of the critical value(s).
D) What is the conclusion to the test?
= 59.80 - 0.44x1- 0.18x2 + 0.17x3; n = 39; SSE = 60.
A) Formulate the hypotheses to determine whether Median Income and the Mortality Rate are jointly significant in explaining Poverty.
B) Calculate the value of the test statistic.
C) At the 5% significance level, find the approximate value of the critical value(s).
D) What is the conclusion to the test?
(Essay)
4.7/5 (31)
Tiffany & Co. has been the world's premier jeweler since 1837. The performance of Tiffany's stock is likely to be strongly influenced by the economy. Monthly data for Tiffany's risk-adjusted return and the risk-adjusted market return are collected for a five-year period (n = 60). The accompanying table shows the regression results when estimating the Capital Asset Pricing Model (CAPM) model for Tiffany's return.  You would like to determine whether an investment in Tiffany's is riskier than the market. When conducting this test, you set up the following competing hypotheses: ________.
(Multiple Choice)
4.8/5 (34)
A researcher analyzes the factors that may influence amusement park attendance. She estimates the following model: Attendance = β0 + β1Price + β2Temperature + β3Rides + ε, where Attendance is the daily attendance (in 1,000s), Price is the gate price (in $), Temperature is the average daily temperature (in °F), and Rides is the number of rides at the amusement park. A portion of the regression results is shown in the accompanying table. 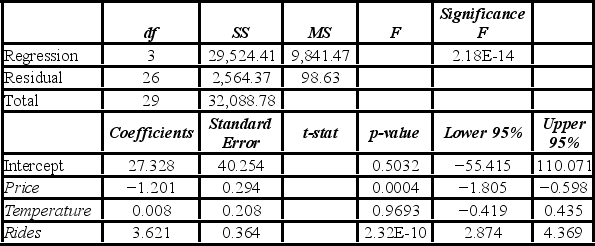 When testing whether the explanatory variables Temperature and Rides are jointly significant, the error sum of squares for the restricted model is SSER = 12,343.78. Which of the following is the value of the test statistic when conducting this test?
(Multiple Choice)
4.8/5 (36)
A manager at a local bank analyzed the relationship between monthly salary (y, in $) and length of service (x, measured in months) for 30 employees. She estimates the following model: Salary = β0 + β1Service + ε. The following table summarizes a portion of the regression results.  Which of the hypotheses will determine whether the slope differs from zero?
(Multiple Choice)
4.7/5 (30)
Consider the following regression results based on 30 observations.  = 238.33 - 0.95x1 + 7.13x2 + 4.76x3; SSE = 3,439
  = 209.56 - 1.03x1 + 5.24(x2 + x3); SSE = 3,559
A) Formulate the hypotheses to determine whether the influences of x2 and x3 differ in explaining y.
B) Calculate the value of the test statistic.
C) At the 5% significance level, find the critical value(s).
D) What is your conclusion to the test?
= 209.56 - 1.03x1 + 5.24(x2 + x3); SSE = 3,559
A) Formulate the hypotheses to determine whether the influences of x2 and x3 differ in explaining y.
B) Calculate the value of the test statistic.
C) At the 5% significance level, find the critical value(s).
D) What is your conclusion to the test?
(Essay)
4.9/5 (36)
If the residuals are correlated, then the residuals should show no pattern around the horizontal axis.
(True/False)
4.8/5 (34)
A manager at a local bank analyzed the relationship between monthly salary (y, in $) and length of service (x, measured in months) for 30 employees. She estimates the following model: Salary = β0 + β1Service + ε. The following table summarizes a portion of the regression results.  Which of the following hypotheses will determine whether the intercept differs from zero?
(Multiple Choice)
4.8/5 (34)
A researcher analyzes the factors that may influence the poverty rate and estimates the
following model: 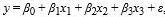 where y is the poverty rate (y, in %),
  is the
percent of the population with at least a high school education,
is the
percent of the population with at least a high school education,  is the median income (in
$1,000), and
is the median income (in
$1,000), and  is the mortality rate (per 1,000 residents). The researcher would like to construct
interval estimates for y when
is the mortality rate (per 1,000 residents). The researcher would like to construct
interval estimates for y when  equal 85%, $50,000, and 10, respectively. The
researcher estimates a modified model where poverty rate is the response variable and the
explanatory variables are now defined as
equal 85%, $50,000, and 10, respectively. The
researcher estimates a modified model where poverty rate is the response variable and the
explanatory variables are now defined as 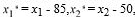 and
and
 . A portion of the regression resuts is shown in the accompanying table.
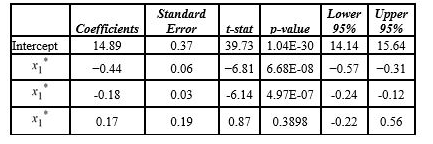 A) According to the modified model, what is the point estimate for the poverty rate when
  and
and  equal 85%, $50,000, and 10, respectivly.
B) According to the modified model, what is a 95% confidence interval for the expected poverty
rate when
equal 85%, $50,000, and 10, respectivly.
B) According to the modified model, what is a 95% confidence interval for the expected poverty
rate when  equal 85%, $50,000, and 10, respectively?
  C) According to the modified model,what is a 95% prediction interval for the poverty rate when
 equal 85%, 50,000, and 10, respectively?
(Essay)
4.7/5 (35)
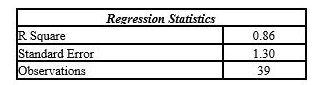
Given the following portion of regression results, which of the following conclusions is true with regard to the F test at the 5% significance level? 
(Multiple Choice)
4.8/5 (34)
A crucial assumption in a regression model is that the error term is not correlated with any of the explanatory variables.
(True/False)
4.9/5 (38)
Consider the following simple linear regression model: y = β0 + β1x + ε. When determining whether there is a negative linear relationship between x and y, the alternative hypothesis takes the form ________.
(Multiple Choice)
4.9/5 (31)
Filters
- Essay(0)
- Multiple Choice(0)
- Short Answer(0)
- True False(0)
- Matching(0)