Exam 15: Inference With Regression Models
Exam 1: Statistics and Data102 Questions
Exam 2: Tabular and Graphical Methods123 Questions
Exam 3: Numerical Descriptive Measures152 Questions
Exam 4: Introduction to Probability148 Questions
Exam 5: Discrete Probability Distributions158 Questions
Exam 6: Continuous Probability Distributions143 Questions
Exam 7: Sampling and Sampling Distributions136 Questions
Exam 8: Interval Estimation131 Questions
Exam 9: Hypothesis Testing116 Questions
Exam 10: Statistical Inference Concerning Two Populations131 Questions
Exam 11: Statistical Inference Concerning Variance120 Questions
Exam 12: Chi-Square Tests120 Questions
Exam 13: Analysis of Variance120 Questions
Exam 14: Regression Analysis140 Questions
Exam 15: Inference With Regression Models125 Questions
Exam 16: Regression Models for Nonlinear Relationships118 Questions
Exam 17: Regression Models With Dummy Variables130 Questions
Exam 18: Time Series and Forecasting125 Questions
Exam 19: Returns, Index Numbers, and Inflation120 Questions
Exam 20: Nonparametric Tests120 Questions
Select questions type
The test statistic for a test of individual significance is assumed to have a t distribution with n - k - 2 degrees of freedom, where n is the sample size and k is the number of explanatory variables.
(True/False)
4.9/5  (31)
(31)
A marketing analyst wants to examine the relationship between sales (in $1,000s) and advertising (in $100s) for firms in the food and beverage industry and so collects monthly data for 25 firms. He estimates the model: Sales = β0 + β1 Advertising + ε. The following table shows a portion of the regression results. 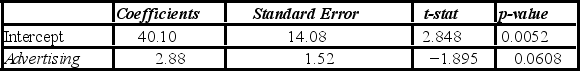 When testing whether the slope coefficient differs from 3, the critical values at the 5% significance level are −2.069 and 2.069. The conclusion to the test is to ________.
(Multiple Choice)
4.8/5 (38)
A researcher analyzes the factors that may influence amusement park attendance and estimates the following model: Attendance = β0 + β1Price + β2Rides + ε, where Attendance is the daily attendance (in 1,000s), Price is the gate price (in $), and Rides is the number of rides at the amusement park. The researcher would like to construct interval estimates for Attendance when Price and Rides equal $85 and 30, respectively. The researcher estimates a modified model where Attendance is the response variable and the explanatory variables are now defined as Price* = Price - 85 and Rides* = Rides - 30. A portion of the regression results is shown in the accompanying table. 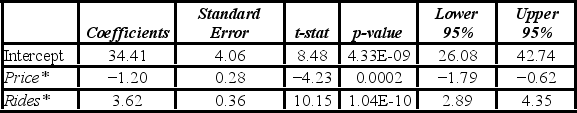 According to the modified model, which of the following is the predicted value for Attendance when Price and Rides equal $85 and 30, respectively?
(Multiple Choice)
4.8/5 (31)
The accompanying table shows the regression results when estimating y = β0 + β1x1 + β2x2 + β3x3 + ε. 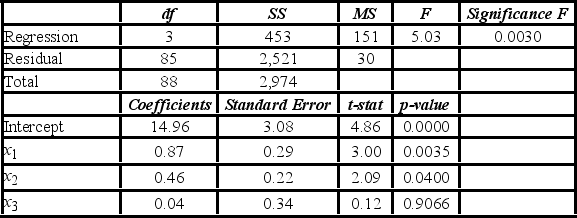 At the 5% significance level, which of the following explanatory variable(s) is(are) individually significant?
(Multiple Choice)
4.8/5 (41)
The accompanying table shows the regression results when estimating y = β0 + β1x1 + β2x2 + β3x3 + ε. 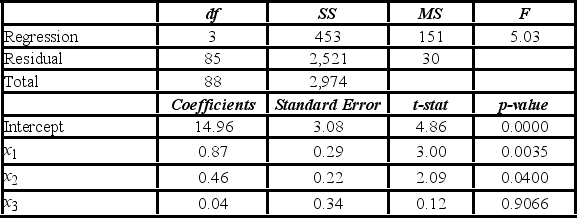 When testing whether or not x1 and x2 have the same influence on y, the null hypothesis is ________.
(Multiple Choice)
4.9/5 (36)
An analyst examines the effect that various variables have on crop yield. He estimates y = β0 + β1x1 + β2x2 + β3x3 + ε. where y is the average yield in bushels per acre, x1 is the amount of summer rainfall, x2 is the average daily use in machine hours of tractors on the farm, and x3 is the amount of fertilizer used per acre. The results of the regression are as follows:  a. At the 10% significance level, are the explanatory variables jointly significant in explaining crop yield? Explain.
B) At the 10% significance level, is fertilizer significant in explaining crop yield? Explain.
C) At the 10% significance level, can you conclude that the slope coefficient attached to rainfall differs from 9? Explain.
a. At the 10% significance level, are the explanatory variables jointly significant in explaining crop yield? Explain.
B) At the 10% significance level, is fertilizer significant in explaining crop yield? Explain.
C) At the 10% significance level, can you conclude that the slope coefficient attached to rainfall differs from 9? Explain.
(Essay)
4.8/5 (32)
The accompanying table shows the regression results when estimating y = β0 + β1x + ε.  When testing whether the slope coefficient differs from 1, the value of the test statistic is ________.
(Multiple Choice)
4.9/5 (38)
Given the following portion of regression results, which of the following is the value of the F(2,20) test statistic? 
(Multiple Choice)
4.7/5 (34)
A manager at a local bank analyzed the relationship between monthly salary (y, in $) and length of service (x, measured in months) for 30 employees. She estimates the following model: Salary = β0 + β1Service + ε. The following table summarizes a portion of the regression results.  Using the 95% confidence interval, which of the following is the conclusion to the following hypothesis test: H0: β0 = 0; HA: β0 ≠ 0?
(Multiple Choice)
4.7/5 (36)
For a given confidence level, the prediction interval is always wider than the confidence interval because ________.
(Multiple Choice)
4.8/5 (38)
An economist estimates the following model: y = β0 + β1x + ε. She would like to construct interval estimates for y when x equals 2. She estimates a modified model where y is the response variable and the explanatory variable is now defined as x+ = x - 2. A portion of the regression results is shown in the accompanying table. 
 According to the modified model, which of the following is a 95% confidence interval for E(y) when x equals 2? (Note that t0.025,10 = 2.228.)
(Multiple Choice)
4.9/5 (40)
A real estate analyst believes that the three main factors that influence an apartment's rent in a college town are the number of bedrooms, the number of bathrooms, and the apartment's square footage. For 40 apartments, she collects data on the rent (y, in $), the number of bedrooms (x1), the number of bathrooms (x2), and its square footage (x3). She estimates the following model: Rent = β0 + β1Bedroom + β2Bath + β3Sqft + ε. The following table shows a portion of the regression results. 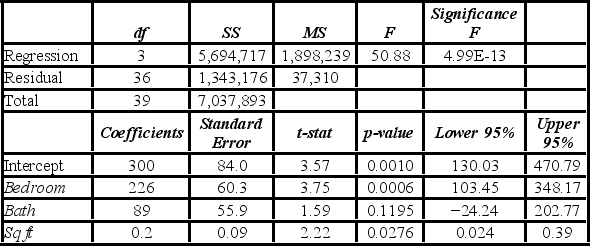 When testing whether Bedroom is significant at the 5% significance level, she ________.
(Multiple Choice)
4.9/5 (41)
A marketing analyst wants to examine the relationship between sales (in $1,000s) and advertising (in $100s) for firms in the food and beverage industry and so collects monthly data for 25 firms. He estimates the model: Sales = β0 + β1 Advertising + ε. The following table shows a portion of the regression results. 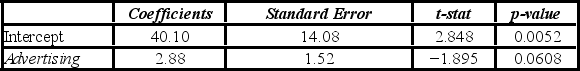 When testing whether Advertising is significant at the 10% significance level, the conclusion is to ________.
(Multiple Choice)
4.8/5 (24)
When some explanatory variables of a regression model are strongly correlated, this phenomenon is called serial correlation.
(True/False)
4.8/5 (34)
The ________ model is a complete model that imposes no restrictions on the coefficients.
(Short Answer)
4.7/5 (35)
When estimating a multiple regression model based on 30 observations, the following results were obtained.  a. Specify the hypotheses to determine whether x1 is linearly related to y. At the 5% significance level, use the p-value approach to complete the test. Are x1 and y linearly related?
B) Construct the 95% confidence interval for β2. Using this confidence interval, is x2 significant in explaining y? Explain.
C) At the 5% significance level, can you conclude that β1 differs from −1? Show the relevant steps of the appropriate hypothesis test.
a. Specify the hypotheses to determine whether x1 is linearly related to y. At the 5% significance level, use the p-value approach to complete the test. Are x1 and y linearly related?
B) Construct the 95% confidence interval for β2. Using this confidence interval, is x2 significant in explaining y? Explain.
C) At the 5% significance level, can you conclude that β1 differs from −1? Show the relevant steps of the appropriate hypothesis test.
(Essay)
4.7/5 (41)
A sociologist wishes to study the relationship between happiness and age. He interviews 24 individuals and collects data on age and happiness, measured on a scale from 0 to 100. He estimates the following model: Happiness = β0 + β1Age + ε. The following table summarizes a portion of the regression results.  At the 1% significance level, which of the following is correct for the test about the population slope?
(Multiple Choice)
4.8/5 (39)
An economist estimates the following model: y = β0 + β1x + ε. She would like to construct interval estimates for y when x equals 2. She estimates a modified model where y is the response variable and the explanatory variable is now defined as x+ = x - 2. A portion of the regression results is shown in the accompanying table. 
 According to the modified model, which of the following is the predicted value of y when x equals 2?
(Multiple Choice)
4.8/5 (32)
A sports analyst wants to exam the factors that may influence a tennis player's chances of winning. Over four tournaments, he collects data on 30 tennis players and estimates the following model: Win = β0 + β1 Double Faults + β2Aces + ε, where Win is the proportion of winning, Double Faults is the percentage of double faults made, and Aces is the number of aces. A portion of the regression results are shown in the accompanying table. 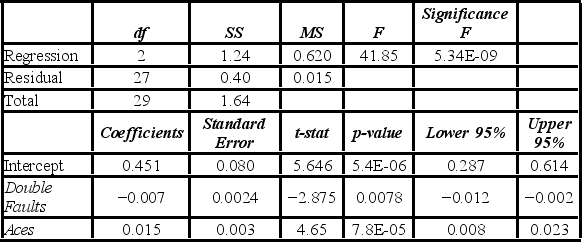 Is the relationship between Win and Aces significant at the 5% significance level?
(Multiple Choice)
4.8/5 (28)
113) In a multiple regression based on 30 observations, the following information is provided:
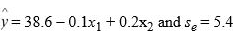 . Also,
  evaluated at
  .
A) Construct a 95% confidence interval for
.
A) Construct a 95% confidence interval for  if
if  equals 40 and
  equals 30.
B) Construct a 95% prediction interval for y if
equals 30.
B) Construct a 95% prediction interval for y if  equals 40 and
  equals 30.
C) Which interval is narrower? Explain.
equals 30.
C) Which interval is narrower? Explain.
(Essay)
4.9/5 (30)
Filters
- Essay(0)
- Multiple Choice(0)
- Short Answer(0)
- True False(0)
- Matching(0)