Exam 15: Inference With Regression Models
Exam 1: Statistics and Data102 Questions
Exam 2: Tabular and Graphical Methods123 Questions
Exam 3: Numerical Descriptive Measures152 Questions
Exam 4: Introduction to Probability148 Questions
Exam 5: Discrete Probability Distributions158 Questions
Exam 6: Continuous Probability Distributions143 Questions
Exam 7: Sampling and Sampling Distributions136 Questions
Exam 8: Interval Estimation131 Questions
Exam 9: Hypothesis Testing116 Questions
Exam 10: Statistical Inference Concerning Two Populations131 Questions
Exam 11: Statistical Inference Concerning Variance120 Questions
Exam 12: Chi-Square Tests120 Questions
Exam 13: Analysis of Variance120 Questions
Exam 14: Regression Analysis140 Questions
Exam 15: Inference With Regression Models125 Questions
Exam 16: Regression Models for Nonlinear Relationships118 Questions
Exam 17: Regression Models With Dummy Variables130 Questions
Exam 18: Time Series and Forecasting125 Questions
Exam 19: Returns, Index Numbers, and Inflation120 Questions
Exam 20: Nonparametric Tests120 Questions
Select questions type
The accompanying table shows the regression results when estimating y = β0 + β1x + ε.  a. Specify the competing hypotheses to determine whether x is significant in explaining y.
B) At the 5% significance level, is x significant in explaining y? Explain.
a. Specify the competing hypotheses to determine whether x is significant in explaining y.
B) At the 5% significance level, is x significant in explaining y? Explain.
(Essay)
4.8/5  (33)
(33)
A researcher studies the relationship between SAT scores, the test-taker's family income, and his or her grade point average (GPA). Data are collected from 24 students. He estimates the following model: SAT = β0 + β1 GPA + β2 Income + ε. The following table summarizes a portion of the regression results.  Which of the following is the value of the test statistic for testing the joint significance of the linear regression model?
(Multiple Choice)
4.9/5 (34)
121) A marketing manager examines the relationship between the attendance at amusement
parks and the price of admission. He estimates the following model: 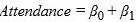 price
price  , where Attendance is the average daily number of people who attend an amusement park in July (in 1,000s) and Price is the price of admission. The marketing manager would like to construct interval estimates for Attendance when Price equals $80. The researcher estimates a modified model where Attendance is the response variable and the Price is now defined as
 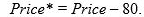 . A portion of the regression results is shown in the accompanying table.
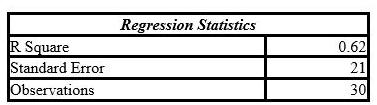
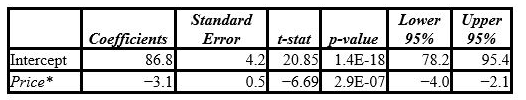 According to the modified model, what is the point estimate for Attendance when Price equals $80?
B) According to the modified model, what is a 95% confidence interval for Attendance when Price equals $80?
According to the modified model, what is the point estimate for Attendance when Price equals $80?
B) According to the modified model, what is a 95% confidence interval for Attendance when Price equals $80?  C) According to the modified model, what is a 95% prediction interval for Attendance when Price equals $80?
(Essay)
4.7/5 (28)
Consider the following regression results based on 30 observations.  Notes: Parameter estimates are in the main body of the table with the p-values in parentheses; * represents significance at 5% level. The last row presents the error sum of squares.
A) Formulate the hypotheses to determine whether x2 and x3 are jointly significant in explaining y.
B) Define the restricted and the unrestricted models needed to conduct the test.
C) Calculate the value of the test statistic.
D) At the 5% significance level, find the critical value(s).
E) What is your conclusion to the test?
Notes: Parameter estimates are in the main body of the table with the p-values in parentheses; * represents significance at 5% level. The last row presents the error sum of squares.
A) Formulate the hypotheses to determine whether x2 and x3 are jointly significant in explaining y.
B) Define the restricted and the unrestricted models needed to conduct the test.
C) Calculate the value of the test statistic.
D) At the 5% significance level, find the critical value(s).
E) What is your conclusion to the test?
(Essay)
4.7/5 (37)
A sociologist wishes to study the relationship between happiness and age. He interviews 24 individuals and collects data on age and happiness, measured on a scale from 0 to 100. He estimates the following model: Happiness = β0 + β1Age + ε. The following table summarizes a portion of the regression results.  Which of the following is the estimate of Happiness for the person who is 65 years old?
(Multiple Choice)
4.9/5 (31)
A researcher analyzes the factors that may influence amusement park attendance. She estimates the following model: Attendance = β0 + β1Price + β2Temperature + β3Rides + ε, where Attendance is the daily attendance (in 1,000s), Price is the gate price (in $), Temperature is the average daily temperature (in °F), and Rides is the number of rides at the amusement park. A portion of the regression results is shown in the accompanying table. 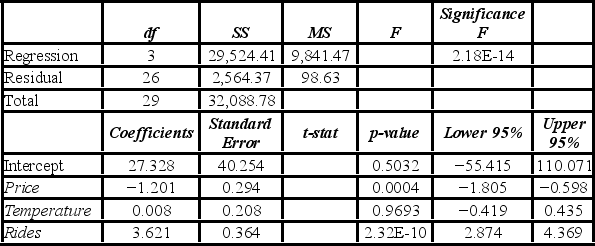 When testing whether the explanatory variables are jointly significant at the 5% significance level, the researcher ________.
(Multiple Choice)
4.7/5 (37)
A researcher studies the relationship between SAT scores, the test-taker's family income, and his or her grade point average (GPA). Data are collected from 24 students. He estimates the following model: SAT = β0 + β1 GPA + β2 Income + ε. The following table summarizes a portion of the regression results.  At the 5% significance level, which of the following explanatory variable(s) is(are) individually significant?
(Multiple Choice)
4.9/5 (36)
Tiffany & Co. has been the world's premier jeweler since 1837. The performance of Tiffany's stock is likely to be strongly influenced by the economy. Monthly data for Tiffany's risk-adjusted return and the risk-adjusted market return are collected for a five-year period  . The accompanying table shows the regression results when estimating the Capital Asset Pricing Model (CAPM) model for Tiffany's return.
 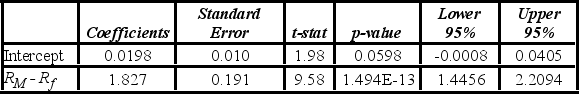 When testing whether there are abnormal returns, the conclusion to the test is at the 5% significance level is to ________.
(Multiple Choice)
4.8/5 (37)
A researcher studies the relationship between SAT scores, the test-taker's family income, and his or her grade point average (GPA). Data are collected from 24 students. He estimates the following model: SAT = β0 + β1 GPA + β2 Income + ε. The following table summarizes a portion of the regression results.  Which of the following is the correct hypotheses for a test about joint significance?
(Multiple Choice)
4.8/5 (30)
One of the required assumptions of regression analysis states that the error term has a(an) ________ value of zero.
(Short Answer)
4.7/5 (38)
Consider the following simple linear regression model: y = β0 + β1x + ε. When determining whether there is a positive linear relationship between x and y, the alternative hypothesis takes the form ________.
(Multiple Choice)
4.9/5 (27)
Which of the following can be used to conduct the test for individual significance of explanatory variables?
(Multiple Choice)
4.8/5 (37)
Assume you ran a multiple regression to gain a better understanding of the relationship between lumber sales, housing starts, and commercial construction. The regression uses LumberSales (in $100,000s) as the response variable with HousingStarts (in 1,000s) and CommercialConstruction (in 1,000s) as the explanatory variables. The results of the regression are as follows:  a. At the 5% significance level, are the explanatory variables jointly significant in explaining LumberSales? Explain.
B) At the 5% significance level, is CommercialConstruction significant in explaining LumberSales? Explain.
C) At the 5% significance level, can you conclude that the slope coefficient attached to HousingStarts differs from 1? Explain.
a. At the 5% significance level, are the explanatory variables jointly significant in explaining LumberSales? Explain.
B) At the 5% significance level, is CommercialConstruction significant in explaining LumberSales? Explain.
C) At the 5% significance level, can you conclude that the slope coefficient attached to HousingStarts differs from 1? Explain.
(Essay)
4.8/5 (27)
Serial correlation occurs when the error term is ________.
(Multiple Choice)
4.9/5 (27)
When confronted with multicollinearity, a good remedy is to ________ if we can justify its redundancy.
(Multiple Choice)
5.0/5 (28)
A sports analyst wants to exam the factors that may influence a tennis player's chances of winning. Over four tournaments, he collects data on 30 tennis players and estimates the following model: Win = β0 + β1Double Faults + β2Aces + ε, where Win is the proportion of winning, Double Faults is the percentage of double faults made, and Aces is the number of aces. A portion of the regression results are shown in the accompanying table. 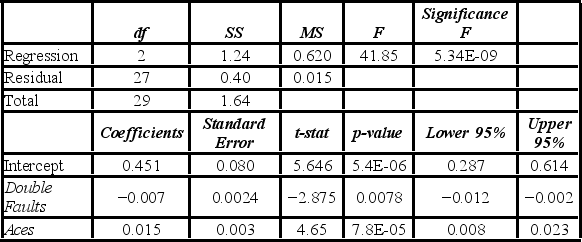 When testing whether the explanatory variables are jointly significant at the 5% significance level, he ________.
(Multiple Choice)
4.9/5 (43)
Consider the following regression results based on 40 observations.  a. Specify the hypotheses to determine if the slope differs from one.
B) Calculate the value of the test statistic.
C) At the 5% significance level, find the critical value(s).
D) Does the slope differ from one? Explain.
a. Specify the hypotheses to determine if the slope differs from one.
B) Calculate the value of the test statistic.
C) At the 5% significance level, find the critical value(s).
D) Does the slope differ from one? Explain.
(Essay)
4.9/5 (33)
A sociologist wishes to study the relationship between happiness and age. He interviews 24 individuals and collects data on age and happiness, measured on a scale from 0 to 100. He estimates the following model: Happiness = β0 + β1Age + ε. The following table summarizes a portion of the regression results.  At the 1% significance level, which of the following is the correct confidence interval of the regression coefficient β1?
(Multiple Choice)
4.8/5 (26)
A researcher analyzes the factors that may influence amusement park attendance and estimates the following model: Attendance = β0 + β1Price + β2Rides + ε, where Attendance is the daily attendance (in 1,000s), Price is the gate price (in $), and Rides is the number of rides at the amusement park. The researcher would like to construct interval estimates for Attendance when Price and Rides equal $85 and 30, respectively. The researcher estimates a modified model where Attendance is the response variable and the explanatory variables are now defined as Price* = Price - 85 and Rides* = Rides - 30. A portion of the regression results is shown in the accompanying table. 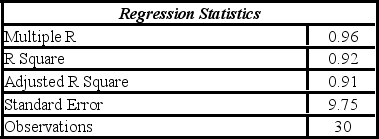
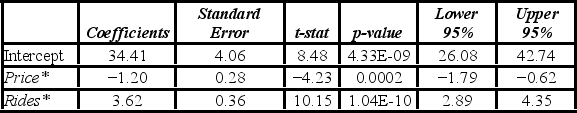 According to the modified model, which of the following is a 95% prediction interval for Attendance when Price and Rides equal $85 and 30, respectively? (Note that t0.025,27 = 2.052.)
(Multiple Choice)
4.7/5 (35)
One of the assumptions of regression analysis is ________.
(Multiple Choice)
4.8/5 (31)
Filters
- Essay(0)
- Multiple Choice(0)
- Short Answer(0)
- True False(0)
- Matching(0)