Exam 3: Displaying and Summarizing Quantitative Data
Exam 1: Stats Starts Here33 Questions
Exam 2: Displaying and Describing Categorical Data70 Questions
Exam 3: Displaying and Summarizing Quantitative Data148 Questions
Exam 4: Understanding and Comparing Distributions46 Questions
Exam 5: The Standard Deviation As a Ruler and the Normal Model111 Questions
Exam 6: Scatterplots, association, and Correlation78 Questions
Exam 7: Linear Regression71 Questions
Exam 8: Regression Wisdom32 Questions
Exam 9: Understanding Randomness26 Questions
Exam 10: Sample Surveys64 Questions
Exam 11: Experiments and Observational Studies80 Questions
Exam 12: From Randomness to Probability69 Questions
Exam 13: Probability Rules95 Questions
Exam 14: Random Variables215 Questions
Exam 15: Sampling Distribution Models51 Questions
Exam 16: Confidence Intervals for Proportions71 Questions
Exam 17: Testing Hypotheses About Proportions44 Questions
Exam 18: More About Tests67 Questions
Exam 19: Comparing Two Proportions53 Questions
Exam 20: Inferences About Means123 Questions
Exam 21: Comparing Means50 Questions
Exam 22: Paired Samples and Blocks35 Questions
Exam 23: Comparing Counts76 Questions
Exam 24: Inferences for Regression57 Questions
Exam 25: Analysis of Variance39 Questions
Exam 26: Multifactor Analysis of Variance22 Questions
Exam 27: Multiple Regression22 Questions
Exam 28: Multiple Regression Wisdom21 Questions
Exam 29: Rank-Based Nonparametric Tests29 Questions
Exam 30: The Bootstrap27 Questions
Select questions type
Here are some summary statistics for the size of forest fires last year: smallest fire = 74 acres, acres, acres, acres, standard deviation = 61 acres.Is the distribution symmetric,skewed to the left,or skewed to the right? Explain.
(Multiple Choice)
4.8/5  (24)
(24)
Here are the prices for 8 different CD players.Find the standard deviation. $254 $323 $268 $446 $222 $313 $308 $144
(Multiple Choice)
4.9/5 (32)
The weights (in kilograms)of 27 dogs are listed below.Find the standard deviation. 1.7 2.0 2.2 2.2 2.4 2.5 2.5 2.5 2.6 2.6 2.6 2.6 2.6 2.7 2.8 2.8 2.8 2.9 2.9 2.9 3.0 3.0 3.1 3.1 3.3 3.6 4.2
(Multiple Choice)
4.9/5 (35)
Which set has the largest standard deviation? Set 1 Set 2 3 7 7 7 10 3 6 7 8 10
(Multiple Choice)
4.8/5 (31)
A medical study of the effects of on Drug X asked adult volunteers to take a heart-rate test one hour after taking Drug X.Some took a placebo (a pill containing no active ingredients),some were given a regular dose of Drug X,and others were given half a regular dose of Drug X.Here are the 5-number summaries for each group's scores on the test (# of beats that the heart rate increased when timed for 60 seconds): Q1 Median Q3 Max Placebo 13 0 1 2 3 5 Half Dose 13 1 2 3 5 8 Reg. Dose 13 1 2 3 7 9 a)Describe the W's for these data.
b)Name the variables and classify each as categorical or quantitative.
c)Write a few sentences comparing the results of the three groups (create parallel boxplots to help you,if necessary.)
(Essay)
4.8/5 (27)
The stem-and-leaf display shows the results of a math test written by 30 students. 10 0 9 11 8 01111123556689 7 556889 6 3778 5 48 4 3 4 2 7 1 0
(Multiple Choice)
4.8/5 (34)
Here are the weekly winnings for several local poker players: $100,$50,$125,$75,$80,$60,$110,$150,$300,$700,$115,$75,$1000,$5000.Which is a better summary of the spread,the standard deviation or the IQR? Explain.
(Multiple Choice)
4.7/5 (34)
Here are some summary statistics for the recent English exam: lowest mean standard Between what two values are the middle 50% of the scores found?
(Multiple Choice)
4.8/5 (40)
The weekly salaries (in dollars)of 24 randomly selected employees of a company are shown below,and displayed on the following boxplot. 310 320 450 460 470 500 520 540 580 600 650 700 710 840 870 900 1000 1200 1250 1300 1400 1720 2500 3700
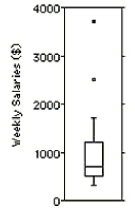 Find the mean and the median.Which is the most appropriate measure of centre?
(Multiple Choice)
5.0/5 (29)
In a college health course,65 students participated in a physical fitness assessment.One measure used in the assessment was body fat.The body fat percentages for the 65 students is given below.Create a histogram of the data using bins that are 2% wide.
12 17 19 22 19
26 15 14 22 11
22 25 27 13 24
14 16 28 27 16
25 27 15 17 30
14 28 28 24 29
24 10 23 35 12
16 25 13 23 25
28 27 24 27 27
12 18 24 17 17
22 26 17 31 25
23 25 26 12 14
17 15 16 19 14
(Essay)
4.9/5 (38)
In May 2014,17 coffee shops in Toronto charged the following amounts,in dollars,for a large cup of coffee (including tax).The lower stem contains leaves with the digits 0-4 and the upper stem contains leaves with digits 5-9. Large Coffee Prices 2.1 2.1 2.0 2.0 1.9 1.9 78
68
0233
567778
344 Key:
1.9 = $1.96
(Multiple Choice)
4.8/5 (24)
A local ice cream shop hand scoops each of its ice cream cones.The cones vary in weight from 140 grams to 305 grams with a mean of 181 grams and a standard deviation of 34 grams.The quartiles and median weights are 148,246,and 202 grams.Find the range and IQR of the weights.
(Multiple Choice)
4.9/5 (34)
John liked to order the all-you-can-eat shrimp at his favorite restaurant.Here are the number of shrimp he ate during his last five visits to the restaurant. 15,16,13,15,10
(Multiple Choice)
4.9/5 (28)
Shown below are the boxplot and the histogram for the highest temperatures ever recorded (in °F)in 32 different states in the U.S.A. 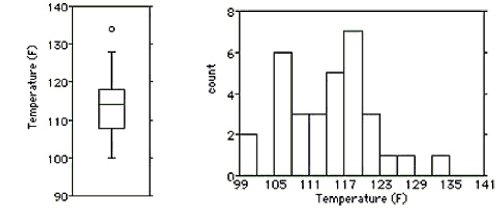 i)What features of the distribution can you see in both the histogram and the boxplot?
ii)What features of the distribution can you see in the histogram that you could not see in the boxplot?
i)What features of the distribution can you see in both the histogram and the boxplot?
ii)What features of the distribution can you see in the histogram that you could not see in the boxplot?
(Multiple Choice)
5.0/5 (33)
Here are some statistics for the annual Wildcat golf tournament: lowest mean standard Between what two values are the middle 50% of the scores found?
(Multiple Choice)
4.8/5 (30)
The speed vehicles travelled on a local road was recorded for one month.The speeds ranged from 52 km/h to 67 km/h with a mean speed of 56 km/h and a standard deviation of 7 km/h.The quartiles and median speeds were 55 km/h,64 km/h,and 53 km/h.Suppose during the month,one driver was clocked at 25 km/h. Which of the summary statistics might not change if that data value was added to the distribution?
(Multiple Choice)
4.7/5 (32)
A student at a local university took a total of 20 exams during freshman year.The student recorded the exam scores as percentages and created the following stem-and-leaf display.The lower stem contains leaves with the digits 0-4 and the upper stem contains leaves with digits 5-9.In addition to describing the distribution,give a reason to account for the shape of this distribution. Exam Grades 9
9
8
8
7
7
6
6
5 555555678 2344 5678 9 14 Key:
9 = 93%
(Multiple Choice)
4.8/5 (28)
The data below represent the midterm grades for 24 students enrolled in an electrical engineering course.Create a stem-and-leaf display of the data.Use split stems.Let the upper leaf represent digits 0-4 and the lower leaf represent 5-9.
85 77 93 91
74 65 68 97
88 59 74 83
85 72 63 79
51 86 70 71
90 75 78 69
(Essay)
4.8/5 (22)
Here are some summary statistics for annual snowfall in a certain town compiled over the last 15 years: lowest cm, cm, cm, cm, standard cm.Is the distribution symmetric,skewed to the left,or skewed to the right? Explain.
(Multiple Choice)
4.7/5 (25)
The display shows the heights of Grade 12 students at a local high school,collected so that the students could be arranged with shorter ones in front and taller ones in back for a class photograph.In addition to describing the distribution,give a reason to account for the shape of this distribution. 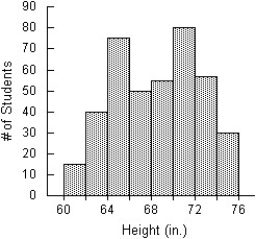
(Multiple Choice)
4.8/5 (36)
Filters
- Essay(0)
- Multiple Choice(0)
- Short Answer(0)
- True False(0)
- Matching(0)