Exam 3: Displaying and Summarizing Quantitative Data
Exam 1: Stats Starts Here33 Questions
Exam 2: Displaying and Describing Categorical Data70 Questions
Exam 3: Displaying and Summarizing Quantitative Data148 Questions
Exam 4: Understanding and Comparing Distributions46 Questions
Exam 5: The Standard Deviation As a Ruler and the Normal Model111 Questions
Exam 6: Scatterplots, association, and Correlation78 Questions
Exam 7: Linear Regression71 Questions
Exam 8: Regression Wisdom32 Questions
Exam 9: Understanding Randomness26 Questions
Exam 10: Sample Surveys64 Questions
Exam 11: Experiments and Observational Studies80 Questions
Exam 12: From Randomness to Probability69 Questions
Exam 13: Probability Rules95 Questions
Exam 14: Random Variables215 Questions
Exam 15: Sampling Distribution Models51 Questions
Exam 16: Confidence Intervals for Proportions71 Questions
Exam 17: Testing Hypotheses About Proportions44 Questions
Exam 18: More About Tests67 Questions
Exam 19: Comparing Two Proportions53 Questions
Exam 20: Inferences About Means123 Questions
Exam 21: Comparing Means50 Questions
Exam 22: Paired Samples and Blocks35 Questions
Exam 23: Comparing Counts76 Questions
Exam 24: Inferences for Regression57 Questions
Exam 25: Analysis of Variance39 Questions
Exam 26: Multifactor Analysis of Variance22 Questions
Exam 27: Multiple Regression22 Questions
Exam 28: Multiple Regression Wisdom21 Questions
Exam 29: Rank-Based Nonparametric Tests29 Questions
Exam 30: The Bootstrap27 Questions
Select questions type
Here are the average mathematics achievement scores for ninth graders in 34 counties.Find the standard deviation. 595 588 587 586 582 580 561 555 551 548 542 540 538 537 534 532 524 523 515 512 501 498 493 489 485 483 465 462 458 444 435 431 407 380
(Multiple Choice)
4.7/5  (32)
(32)
Here are some summary statistics for annual snowfall in a certain town compiled over the last 15 years: lowest cm, cm, cm, cm, standard cm.Between what two values are the middle 50% of snowfall found?
(Multiple Choice)
4.9/5 (37)
The semester point totals of 16 students are listed below.Find the interquartile range (IQR)by hand. 787 640 820 677
475 611 527 667
574 687 875 512
592 460 542 490
(Multiple Choice)
4.8/5 (34)
Here is the stem-and-leaf display of the midterm test scores for the seventh-period typing class. 5 6 7 8 9 9 358 24479 3558 137 Would you use the median or the mean to describe the centre of this distribution?
(Multiple Choice)
4.9/5 (40)
The local Tupperware dealers earned the following commissions,in dollars,last month. $1863.64 $4955.86 $3482.51
$2342.19 $4773.76 $4720.40
$2050.10 $4263.18 $4897.60
$3314.73
Round your answer to the nearest cent.
(Multiple Choice)
4.7/5 (41)
Here are costs (in dollars)of 12 refrigerators.Find the range. 845 970 635 545 1445 1070
670 745 780 1270 535 1045
(Multiple Choice)
5.0/5 (35)
Here are the weekly winnings for several local poker players: $100,$50,$125,$75,$80,$60,$110,$150,$300,$700,$115,$75,$1000,$5000.Which is a better summary of the scores,the mean or the median? Explain.
(Multiple Choice)
4.9/5 (25)
Shown below are the boxplot and summary statistics for the heights,in centimetres,of a class of Grade 3 students in Halifax,NS. 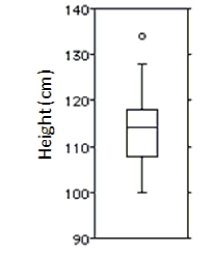 Count 32 Mean 114.2 Median 114.5 StdDev 7.7 Min 100 Max 134 Q1 107.5 Q3 118 Which measures of centre and spread would you use for this distribution?
(Multiple Choice)
4.7/5 (40)
The annual incomes,in dollars,of several doctors are listed below. 130,000 132,000 188,000 242,000 238,000 148,000 114,000 833,000 200,000 151,000
(Multiple Choice)
4.9/5 (41)
The number of days off that 30 police officers took in a given year are provided below.Create a histogram of the data using bins 2 days wide.
10 1 3 5 4 7
5 1 0 9 11 1
5 4 1 7 7 11
0 6 6 1 5 7
10 1 1 5 6 0
(Essay)
4.8/5 (22)
The weights,in kilograms,of the members of the varsity football team are listed below.Create a stem-and-leaf display of the data.Use split stems by separating each stem into 5 stems.
72 76 71 75 80 76
65 82 70 76 70 75
72 67 78 74 66 86
80 68 80 74 85 82
(Essay)
4.8/5 (33)
Shown below are the histogram and summary statistics for the reading scores of 29 fifth graders. 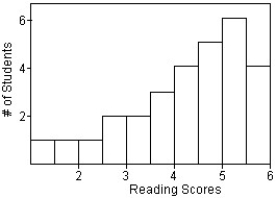 Count Mean Median StdDev Min Max Q1 Q3 29 4.2 4.6 1.3 1.3 5.9 3.5 5.4 Which measures of centre and spread would you use for this distribution?
(Multiple Choice)
4.9/5 (30)
A consumer group surveyed the prices for a certain item in five different stores and reported the mean price to be $15.If you visited four of these stores and found their prices to $10,$15,$17,and $25,what is the price of this item at the fifth store?
(Multiple Choice)
4.8/5 (40)
Here are some summary statistics for last year's basketball team scoring output: lowest points, points, points, points, standard points.Is the distribution symmetric,skewed to the left,or skewed to the right? Explain.
(Multiple Choice)
4.9/5 (26)
Students were asked to make a histogram of the number of corn snakes collected in Will County,Illinois from 1985 to 2006.They were given the data in the form of a stem-and-leaf display shown below: 0 1 2 3 4 5 6 24 17899 01378 699 224 7 035 = 57 corn snakes
One student submitted the following display: 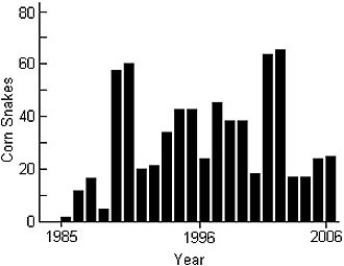 a)Comment on this graph.
b)Create your own histogram of the data.
a)Comment on this graph.
b)Create your own histogram of the data.
(Essay)
4.9/5 (37)
Here are some statistics for the annual Wildcat golf tournament: lowest score = 56,mean standard Is the distribution symmetric,skewed to the left,or skewed to the right? Explain.
(Multiple Choice)
4.8/5 (40)
A small company employs a supervisor at $1300 a week,an inventory manager at $900 a week,5 stock boys at $400 a week,and 3 drivers at $500 a week.
(Multiple Choice)
4.9/5 (39)
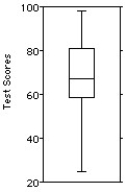
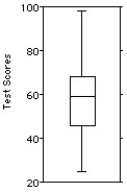
The test scores of 40 students are listed below. 25 35 43 44 47 48 54 55 56 57 59 62 63 65 66 68 69 69 71 71 73 73 74 76 77 77 78 79 80 81 81 82 83 85 89 92 93 94 97 98 Choose the boxplot that represents the given data.
I 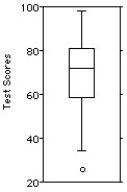 II
II
 III
III
 IV
IV  V
V 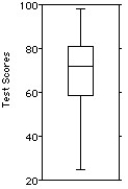
(Multiple Choice)
4.8/5 (37)
The following data consists of the heights,in centimetres,of 15 randomly selected female high school students and 15 randomly selected male high school students. 128 150 118 166 142 122 137 110 175 152 145 126 139 111 170 140 153 199 186 169 136 176 162 196 155 173 190 141 166 153 Choose the back-to-back stemplot that represents the given data.
I Men Women 11 018 12 268 6 13 79 10 14 25 533 15 02 962 16 06 63 17 5 60 18 96 19
II Men Women 11 01 12 268 6 13 79 10 14 25 533 15 024 962 16 6 63 17 05 96 18 96 19
III Men Women 11 018 12 268 6 13 79 10 14 25 533 15 02 962 16 6 63 17 05 6 18 960 19
IV
Men Women 11 018 12 26 6 13 789 10 14 25 533 15 02 96 16 6 632 17 05 6 18 960 19
V Men Women 11 018 12 26 6 13 789 1 14 25 533 15 02 96 16 6 632 17 05 6 18 960 19
(Multiple Choice)
4.9/5 (39)
Here are the average mathematics achievement scores for ninth graders in 32 counties.Find the standard deviation. 599 585 574 572 569 565 564 551 539 534 531 528 525 524 519 501 488 480 478 475 471 465 458 443 427 410 409 389 380 382 355 314
(Multiple Choice)
4.9/5 (34)
Filters
- Essay(0)
- Multiple Choice(0)
- Short Answer(0)
- True False(0)
- Matching(0)