Exam 3: Displaying and Summarizing Quantitative Data
Exam 1: Stats Starts Here33 Questions
Exam 2: Displaying and Describing Categorical Data70 Questions
Exam 3: Displaying and Summarizing Quantitative Data148 Questions
Exam 4: Understanding and Comparing Distributions46 Questions
Exam 5: The Standard Deviation As a Ruler and the Normal Model111 Questions
Exam 6: Scatterplots, association, and Correlation78 Questions
Exam 7: Linear Regression71 Questions
Exam 8: Regression Wisdom32 Questions
Exam 9: Understanding Randomness26 Questions
Exam 10: Sample Surveys64 Questions
Exam 11: Experiments and Observational Studies80 Questions
Exam 12: From Randomness to Probability69 Questions
Exam 13: Probability Rules95 Questions
Exam 14: Random Variables215 Questions
Exam 15: Sampling Distribution Models51 Questions
Exam 16: Confidence Intervals for Proportions71 Questions
Exam 17: Testing Hypotheses About Proportions44 Questions
Exam 18: More About Tests67 Questions
Exam 19: Comparing Two Proportions53 Questions
Exam 20: Inferences About Means123 Questions
Exam 21: Comparing Means50 Questions
Exam 22: Paired Samples and Blocks35 Questions
Exam 23: Comparing Counts76 Questions
Exam 24: Inferences for Regression57 Questions
Exam 25: Analysis of Variance39 Questions
Exam 26: Multifactor Analysis of Variance22 Questions
Exam 27: Multiple Regression22 Questions
Exam 28: Multiple Regression Wisdom21 Questions
Exam 29: Rank-Based Nonparametric Tests29 Questions
Exam 30: The Bootstrap27 Questions
Select questions type
The frequency table shows the weight,in kilograms,of 120 adults,rounded to the nearest kilogram. Weight Count Weight Count 60 1 68 12 61 6 69 6 62 7 70 3 63 5 71 12 64 8 72 10 65 7 73 2 66 7 74 4 67 25 75 5
(Multiple Choice)
4.8/5  (38)
(38)
The weekly salaries (in dollars)of sixteen government workers are listed below. 690 594 813 636 728 585 486 634 534 679 685 451 558 787 503 826
(Multiple Choice)
4.7/5 (35)
A university instructor created a website for her Chemistry course.The students in her class were encouraged to use the website as an additional resource for the course.At the end of the semester,the instructor asked each student how many times he or she visited the website and recorded the counts.Based on the histogram below,describe the distribution of website use. 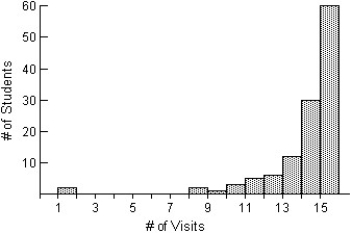
(Multiple Choice)
4.8/5 (34)
Here are the number of baseball games that Dave attended over the last several seasons. 1 15 17 21 30 30 49
(Multiple Choice)
4.7/5 (32)
Office workers were asked how long it took them to travel to work one morning.Here is the stem-and-leaf display. 2 3 4 5 6 0002344578 0257 12789 028 05 Would you use the median or the mean to describe the centre of this distribution?
(Multiple Choice)
4.9/5 (39)
Here is the boxplot and an ogive of the distribution of students marks on their statistics test. 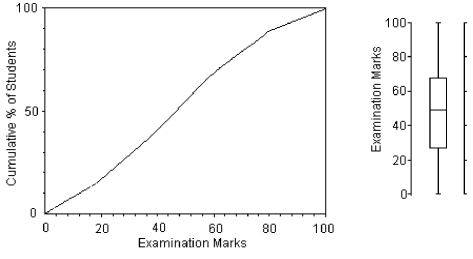 Write a few sentences describing this distribution.
(Multiple Choice)
4.9/5 (47)
The free throw percentages for participants in a basketball tournament were compiled.The percents ranged from 31% to 91% with a mean of 63% and a standard deviation of 6%.The quartiles and median percentages were 41%,79%,and 63%.Suppose one participant did not make any of his attempted free throws (0%).Which of the summary statistics might not change if that data value was added to the distribution?
(Multiple Choice)
4.8/5 (43)
Ages of patients who had their tonsils removed at a hospital over the course of a year.
(Multiple Choice)
4.8/5 (25)
The weekly salaries,in dollars,of 16 government workers are listed below.Find the upper quartile (Q3)by hand. $492 $791 $545 $840
$506 $734 $620 $815
$676 $874 $450 $561
$713 $473 $654 $527
(Multiple Choice)
4.9/5 (32)
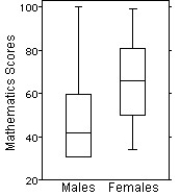
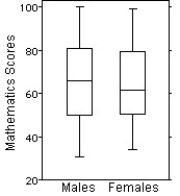
Here are the summary statistics for mathematics scores for one high-school graduating class. Mean Median SD Min Max Q1 Q3 Male 17 60 63 18.6 30 100 52 78 Female 18 65 66 17.7 36 98 50 80 Choose the boxplot that represents the given data.
I 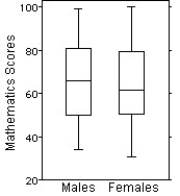 II
II
 III
III
 IV
IV 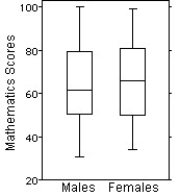 V
V
(Multiple Choice)
4.8/5 (22)
A dotplot of the number of tornadoes each year in a certain county from 1948 to 2004 is given.Each dot represents a year in which there were that many tornadoes. 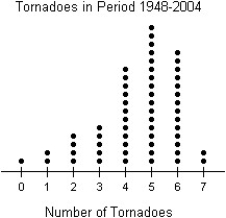
(Multiple Choice)
4.8/5 (37)
The test scores of 15 students are listed below.Find the lower quartile (Q1)by hand. 41 49 50 55 58
64 65 68 72 76
85 87 90 94 95
(Multiple Choice)
4.8/5 (30)
The histogram displays the body fat percentages of 65 students taking a college health course.In addition to describing the distribution,give a reason to account for the shape of this distribution. 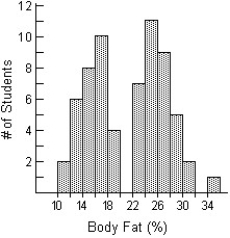
(Multiple Choice)
4.8/5 (37)
The histograms display the body fat percentages of 42 female students and 48 male students taking a college health course.For which of the variables depicted in the histograms would you be most satisfied to summarize the centre with a mean? Explain. 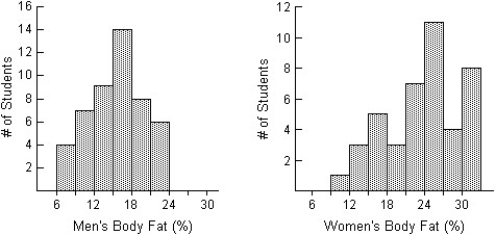
(Multiple Choice)
4.9/5 (38)
Here are summary statistics of the four last digits of social security number of 500 customers,corresponding to the following histogram. Count 500 Mean 4919 StdDev 1556 Median 5009 IQR 2009 Q1 4018 Q3 6027
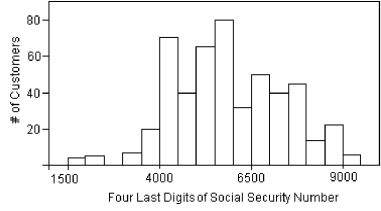 Is the mean or median a "better" summary of the centre of the distribution?
(Multiple Choice)
4.8/5 (31)
Here are some summary statistics for all of the runners in a local 12 kilometre race: slowest minutes minutes minutes minutes standard minutes
Between what two values are the middle 50% of times?
(Multiple Choice)
4.7/5 (31)
The weekly salaries,in dollars,of 16 government workers are listed below.Find the lower quartile (Q1)by hand. \ 690 \ 589 \ 813 \ 656 \ 728 \ 556 \ 491 \ 614 \ 532 \ 662 \ 685 \ 462 \ 542 \ 787 \ 511 \ 826
(Multiple Choice)
4.9/5 (35)
The following stem-and-leaf display shows the number of homeless cats and dogs that had to be euthanized each year in a large city for the period 1995-2014. Animal Totals 90
89
88
87
86
85
84
83
82
81 2 3 5557 157 2 3357 223556 Key:
87 = 87,500 cats and dogs euthanized
(Multiple Choice)
4.9/5 (29)
Filters
- Essay(0)
- Multiple Choice(0)
- Short Answer(0)
- True False(0)
- Matching(0)