Exam 3: Displaying and Summarizing Quantitative Data
Exam 1: Stats Starts Here33 Questions
Exam 2: Displaying and Describing Categorical Data70 Questions
Exam 3: Displaying and Summarizing Quantitative Data148 Questions
Exam 4: Understanding and Comparing Distributions46 Questions
Exam 5: The Standard Deviation As a Ruler and the Normal Model111 Questions
Exam 6: Scatterplots, association, and Correlation78 Questions
Exam 7: Linear Regression71 Questions
Exam 8: Regression Wisdom32 Questions
Exam 9: Understanding Randomness26 Questions
Exam 10: Sample Surveys64 Questions
Exam 11: Experiments and Observational Studies80 Questions
Exam 12: From Randomness to Probability69 Questions
Exam 13: Probability Rules95 Questions
Exam 14: Random Variables215 Questions
Exam 15: Sampling Distribution Models51 Questions
Exam 16: Confidence Intervals for Proportions71 Questions
Exam 17: Testing Hypotheses About Proportions44 Questions
Exam 18: More About Tests67 Questions
Exam 19: Comparing Two Proportions53 Questions
Exam 20: Inferences About Means123 Questions
Exam 21: Comparing Means50 Questions
Exam 22: Paired Samples and Blocks35 Questions
Exam 23: Comparing Counts76 Questions
Exam 24: Inferences for Regression57 Questions
Exam 25: Analysis of Variance39 Questions
Exam 26: Multifactor Analysis of Variance22 Questions
Exam 27: Multiple Regression22 Questions
Exam 28: Multiple Regression Wisdom21 Questions
Exam 29: Rank-Based Nonparametric Tests29 Questions
Exam 30: The Bootstrap27 Questions
Select questions type
The histogram shows the sizes (in acres)of 169 farms in Ontario.In addition to describing the distribution,approximate the percentage of farms that are under 100 acres. 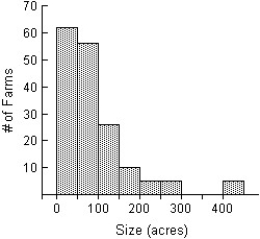
(Multiple Choice)
4.7/5  (42)
(42)
Last weekend police ticketed 18 men whose mean speed was 72 miles per hour,and 30 women going an average of 64 mph.Overall,what was the mean speed of all the people ticketed?
(Multiple Choice)
4.8/5 (32)
Here are some summary statistics for all of the runners in a local 12 kilometre race: slowest minutes minutes minutes minutes standard minutes
Is the distribution symmetric,skewed to the left,or skewed to the right? Explain.
(Multiple Choice)
4.9/5 (33)
Here are some summary statistics for the size of forest fires last year: smallest acres, acres, acres, acres, standard acres.Between what two values are the middle 50% of fire sizes found?
(Multiple Choice)
4.7/5 (31)
Shown below are the boxplot and the histogram for the weights (in pounds)of 30 newborn babies in Edmonton,Alberta in May,2014. 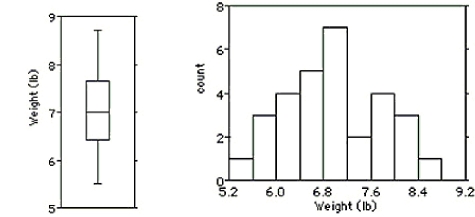 i)What features of the distribution can you see in both the histogram and the boxplot?
ii)What features of the distribution can you see in the histogram that you could not see in the boxplot?
i)What features of the distribution can you see in both the histogram and the boxplot?
ii)What features of the distribution can you see in the histogram that you could not see in the boxplot?
(Multiple Choice)
4.8/5 (29)
The weights (in pounds)of 30 newborn babies are listed below. 5.5 5.7 5.8 5.9 6.1 6.1 6.3 6.4 6.5 6.6
6.7 6.7 6.7 6.9 7.0 7.0 7.0 7.1 7.2 7.2
7.4 7.5 7.7 7.7 7.8 8.0 8.1 8.1 8.3 8.7 Choose the boxplot that represents the given data.
I 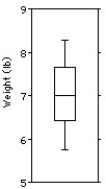 II
II
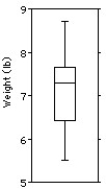 III
III 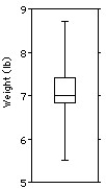 IV
IV 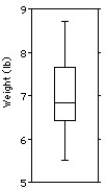 V
V 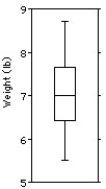
(Multiple Choice)
4.8/5 (29)
The back-to-back dotplot shows the number of fatalities per year caused by tornadoes in a certain state for two periods: 1950-1974 and 1975-1999.Explain how you would summarize the centre and spread of each of the variables depicted in the dotplots. 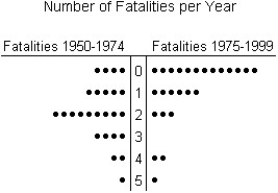
(Multiple Choice)
4.8/5 (30)
The speed vehicles travelled on a local road was recorded for one month.The speeds ranged from 50 km/h to 65 km/h with a mean speed of 55 km/h and a standard deviation of 7 km/h.The quartiles and median speeds were 53 km/h,62 km/h,and 52 km/h.Is the distribution symmetric,skewed to the left,or skewed to the right? Explain.
(Multiple Choice)
4.9/5 (37)
The test scores of 19 students are listed below.Find the upper quartile (Q3)by hand. 36 45 49 53 55
56 59 61 62 65
67 71 75 79 82
88 90 92 97
(Multiple Choice)
4.9/5 (34)
A weight-loss company used the following histogram to show the distribution of the number of pounds lost by clients during the year 2014.Comment on the display. 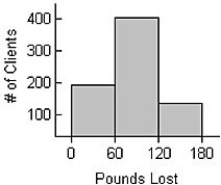
(Essay)
5.0/5 (40)
Shown below are the boxplot,the histogram and summary statistics for the weights (in pounds)of 30 newborn babies:  Count Mean Median StdDev Min Max Q1 Q3 30 6.9 7.0 0.8 5.5 8.7 6.4 7.7 Write a few sentences describing the distribution.
(Multiple Choice)
4.8/5 (32)
Here is the stem-and-leaf display of the midterm test scores for the seventh-period mathematics class.Describe the distribution (shape,centre,spread,unusual features). Midterm Test Scores 10 0 9 11 8 0001123556678 7 555889 6 4778 5 39 4 3 3 2 9 1 0 Key:
7 = 75 points
(Multiple Choice)
4.9/5 (42)
The stem-and-leaf diagram shows the ages of 17 people at a playground in London,Ontario. Age (in years) 7
6
5
4
3
2
1
0 1 3 04 23 233568 78 466 Key:
3 = 33 years
(Multiple Choice)
4.8/5 (27)
Heights of a group of male professional athletes,half of whom are gymnasts and half of whom are basketball players.
(Multiple Choice)
4.8/5 (36)
The students in a math class took the Scholastic Aptitude Test.Their math scores are shown below. 567 630 350 353 503
356 354 552 470 482
(Multiple Choice)
4.8/5 (39)
The free throw percentages for the participants in a basketball tournament were compiled.The percents ranged from 33% to 99% with a mean of 56% and a standard deviation of 7%.The quartiles and median percentages were 43%,87%,and 56%.Is the distribution symmetric,skewed to the left,or skewed to the right? Explain.
(Multiple Choice)
4.8/5 (39)
A local ice cream shop hand scoops each of its ice cream cones.The cones vary in weight from 120 grams to 216 grams with a mean of 181 grams and a standard deviation of 34 grams.The quartiles and median weights are 146,244,and 202 grams. Is the distribution symmetric,skewed to the left,or skewed to the right? Explain.
(Multiple Choice)
4.8/5 (37)
Here are the number of hours that Bill has exercised each week since he started keeping records. 8.5 6.5 7.1 8.7 6.9 8.5
8.6 7.1 7.8 8.5 8.7 7.9
8.6 6.5 6.5 8.8 6.9 8.6
Round your answer to the nearest tenth.
(Multiple Choice)
4.9/5 (41)
Jody got a bank statement each month that listed the balance,in dollars,in her checking account.Here are the balances on several statements. $508.73 $191.48 $535.85 $381.72 $315.88
$485.86 $533.66 $508.12 $515.49
Round your answer to the nearest cent.
(Multiple Choice)
4.7/5 (38)
The employees at Frank's Furniture earned the following amounts,in dollars,last week. $540.68 $186.11 $264.76 $495.65 $156.26 $533.66
Round your answer to the nearest cent.
(Multiple Choice)
4.8/5 (33)
Filters
- Essay(0)
- Multiple Choice(0)
- Short Answer(0)
- True False(0)
- Matching(0)