Exam 3: Displaying and Summarizing Quantitative Data
Exam 1: Stats Starts Here33 Questions
Exam 2: Displaying and Describing Categorical Data70 Questions
Exam 3: Displaying and Summarizing Quantitative Data148 Questions
Exam 4: Understanding and Comparing Distributions46 Questions
Exam 5: The Standard Deviation As a Ruler and the Normal Model111 Questions
Exam 6: Scatterplots, association, and Correlation78 Questions
Exam 7: Linear Regression71 Questions
Exam 8: Regression Wisdom32 Questions
Exam 9: Understanding Randomness26 Questions
Exam 10: Sample Surveys64 Questions
Exam 11: Experiments and Observational Studies80 Questions
Exam 12: From Randomness to Probability69 Questions
Exam 13: Probability Rules95 Questions
Exam 14: Random Variables215 Questions
Exam 15: Sampling Distribution Models51 Questions
Exam 16: Confidence Intervals for Proportions71 Questions
Exam 17: Testing Hypotheses About Proportions44 Questions
Exam 18: More About Tests67 Questions
Exam 19: Comparing Two Proportions53 Questions
Exam 20: Inferences About Means123 Questions
Exam 21: Comparing Means50 Questions
Exam 22: Paired Samples and Blocks35 Questions
Exam 23: Comparing Counts76 Questions
Exam 24: Inferences for Regression57 Questions
Exam 25: Analysis of Variance39 Questions
Exam 26: Multifactor Analysis of Variance22 Questions
Exam 27: Multiple Regression22 Questions
Exam 28: Multiple Regression Wisdom21 Questions
Exam 29: Rank-Based Nonparametric Tests29 Questions
Exam 30: The Bootstrap27 Questions
Select questions type
The data below give the number of tornadoes that happened each year in a certain county from 1948 through 2004.Create a dotplot of these data.
2 6 2 4 5 1
4 5 6 4 3 5
6 6 4 5 5 4
0 4 5 6 6 5
7 5 5 3 7 2
3 2 5 6 6 6
6 6 4 5 4 5
4 5 6 6 5 4
5 6 5 4 5 4
3 3 1
(Essay)
4.8/5  (32)
(32)
The ages of the 21 members of a track and field team are listed below. 15 18 18 19 22 23 24 24 24 24 25 26 26 27 28 28 30 32 33 40 42 Choose the boxplot that represents the given data.
I 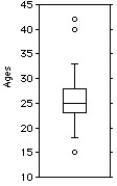 II
II
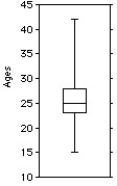 III
III 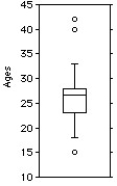 IV
IV 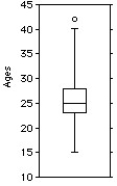 V
V

(Multiple Choice)
4.7/5 (37)
The histogram shows the cost of living,in dollars,in 32 Canadian towns. 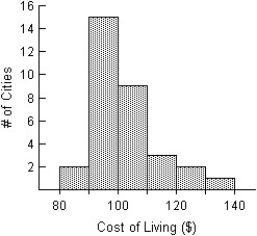
(Multiple Choice)
4.8/5 (39)
A small company employs a supervisor at $1300 a week,an inventory manager at $600 a week,5 stock boys at $300 a week each,and 3 drivers at $500 a week each.
(Multiple Choice)
4.8/5 (30)
Here are the amounts,in dollars,spent by six students at a university book store. $267.25 $167.42 $288.70 $148.22 $228.43 Round your answer to the nearest cent.
(Multiple Choice)
4.8/5 (27)
The diastolic blood pressures,in mm Hg,for a sample of patients at a clinic are given.Create a stem-and-leaf display of the data.Do not use split stems.
78 87 91 85 97
102 73 90 110 105
94 85 81 95 77
106 84 111 83 92
79 81 96 88 100
85 89 101 83 120
88 95 78 74 105
85 87 92 114 83
(Essay)
4.7/5 (34)
Here are the average mathematics achievement scores for ninth graders in 32 counties. 607\nobreakspace585\nobreakspace574\nobreakspace572\nobreakspace569\nobreakspace565\nobreakspace564\nobreakspace558 542\nobreakspace534\nobreakspace531\nobreakspace528\nobreakspace525\nobreakspace524\nobreakspace519\nobreakspace516 498\nobreakspace480\nobreakspace478\nobreakspace475\nobreakspace471\nobreakspace465\nobreakspace458\nobreakspace446 419\nobreakspace410\nobreakspace409\nobreakspace389\nobreakspace380\nobreakspace382\nobreakspace355\nobreakspace324
(Multiple Choice)
4.7/5 (40)
Shown below are the boxplot and the histogram for the weekly salaries (in dollars)of 24 randomly selected employees of a company: 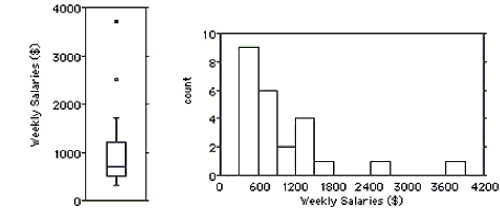 i)What features of the distribution can you see in both the histogram and the boxplot?
ii)What features of the distribution can you see in the boxplot that you could not see in the histogram?
i)What features of the distribution can you see in both the histogram and the boxplot?
ii)What features of the distribution can you see in the boxplot that you could not see in the histogram?
(Multiple Choice)
4.9/5 (26)
The number of cars passing through a Tim Hortons "drive-thru" during each 15-minute period was recorded.The results are shown below. 20 22 20 23
23 20 25 22
30 26 26 24
19 26 20 15
10 22 22 22
(Multiple Choice)
4.8/5 (37)
Shown below are the boxplot,the histogram and summary statistics for the weekly salaries (in dollars)of 24 randomly selected employees of a company: 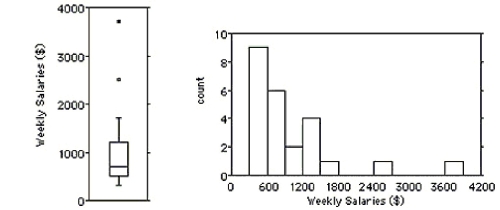 Count Mean Median StdDev Min Max Q1 Q3 24 978.8 705 765.7 310 3700 510 1225 Write a few sentences describing the distribution.
(Multiple Choice)
4.7/5 (22)
A sewing supply company has a database of tens of thousands of products that they sell in their stores.One of the variables in the database,Thread_Colour,contains the names of the colors of the various spools of thread that are sold.The most commonly sold are white,black,and brown,but there are also magenta,azure,sea foam green,and nutmeg,to name a few others.In all there are more than 500 different colours,each with a corresponding numeric code.Here are a few of them: Code Colour 000 white 001 black 002 prown 003 yellow 004 plue 005 red 009 violet 010 magenta 127 sea foam green 128 hutmeg 134 turquoise 159 evergreen 687 midnight blue 508 teal An intern who was asked to analyze the company's thread sales presented these summary statistics for the variable Thread_Colour: Mean 35.89 StdDev 784.92 Median 2 3 87602 a)What does the mean of 35.89 mean?
b)What are the typical reasons that cause measures of centre and spread to be as different as those in this table?
c)Is that why these are so different?
(Essay)
4.8/5 (36)
Here are the highest temperatures ever recorded (in °F)in 32 different states in the U.S.A.
100 100 105 105 106 106 107 107
108 110 110 112 112 112 114 114
114 115 116 117 118 118 118 118
118 119 120 121 122 125 128 134
Choose the boxplot that represents the given data.
I
 II
II 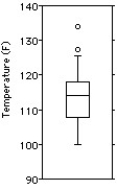 III
III 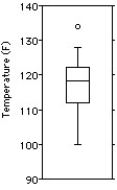 IV
IV 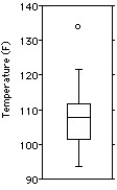 V
V 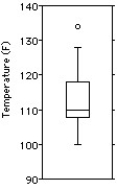
(Multiple Choice)
4.8/5 (40)
The test scores of 19 students are listed below.Find the range. 91 99 86 54 72
85 97 91 90 66
82 83 78 88 77
80 92 94 98
(Multiple Choice)
4.8/5 (36)
The diastolic blood pressures,in mm Hg,for a sample of patients at a clinic are given.Create a stem-and-leaf display of the data.Use split stems.Let the upper leaf represent digits 0-4 and the lower leaf represent 5-9.
78 87 91 85 97
102 73 90 110 105
94 85 81 95 77
106 84 111 83 92
79 81 96 88 100
85 89 101 83 120
88 95 78 74 105
85 87 92 114 83
(Essay)
4.8/5 (32)
The weights,in kilograms,of 17 randomly selected adults are given below.Find the interquartile range (IQR)by hand. 65.3 74.8 84.8 64.9 54.0 59.9
57.6 70.8 81.2 72.1 81.6 91.6
51.7 66.2 68.5 76.2 78.5
(Multiple Choice)
4.8/5 (37)
The precipitation,in millimetres,for August is given for 20 different Canadian cities. 113 67 56 43 27
93 58 147 72 58
86 74 39 25 36
103 50 37 36 82
(Multiple Choice)
4.8/5 (30)
Here are summary statistics for the time,in minutes,it took for 20 people to complete an information survey at a walk-in medical clinic. Count Mean Median StdDev Min Max Q1 Q3 20 3.23 3.45 1.2 0.4 7.0 2.1 3.8 Write a few sentences about the amount of time these people took to complete the information survey.
(Multiple Choice)
4.8/5 (33)
A clerk entering salary data into a company spreadsheet accidentally omitted a "0" in the CEO's salary,listing it as $155,000 instead of $1,550,000.Explain how this error will affect these summary statistics for the company payroll: a)measures of centre: median and mean; and b)measures of spread: range,IQR,and standard deviation.
(Essay)
4.9/5 (39)
Here are summary statistics for the time,in minutes,it took for 20 people to complete an information survey at a walk-in medical clinic. Count Mean Median StdDev Min Max Q1 Q3 20 3.23 3.45 1.2 0.4 7.0 2.1 3.8 Would you describe this distribution as symmetric or skewed?
(Multiple Choice)
4.9/5 (39)
Which set has the largest standard deviation? Set 1 Set 2 7 12 15 14 19 52 60 62 61 68
(Multiple Choice)
4.8/5 (36)
Filters
- Essay(0)
- Multiple Choice(0)
- Short Answer(0)
- True False(0)
- Matching(0)