Exam 3: Displaying and Summarizing Quantitative Data
Exam 1: Stats Starts Here33 Questions
Exam 2: Displaying and Describing Categorical Data70 Questions
Exam 3: Displaying and Summarizing Quantitative Data148 Questions
Exam 4: Understanding and Comparing Distributions46 Questions
Exam 5: The Standard Deviation As a Ruler and the Normal Model111 Questions
Exam 6: Scatterplots, association, and Correlation78 Questions
Exam 7: Linear Regression71 Questions
Exam 8: Regression Wisdom32 Questions
Exam 9: Understanding Randomness26 Questions
Exam 10: Sample Surveys64 Questions
Exam 11: Experiments and Observational Studies80 Questions
Exam 12: From Randomness to Probability69 Questions
Exam 13: Probability Rules95 Questions
Exam 14: Random Variables215 Questions
Exam 15: Sampling Distribution Models51 Questions
Exam 16: Confidence Intervals for Proportions71 Questions
Exam 17: Testing Hypotheses About Proportions44 Questions
Exam 18: More About Tests67 Questions
Exam 19: Comparing Two Proportions53 Questions
Exam 20: Inferences About Means123 Questions
Exam 21: Comparing Means50 Questions
Exam 22: Paired Samples and Blocks35 Questions
Exam 23: Comparing Counts76 Questions
Exam 24: Inferences for Regression57 Questions
Exam 25: Analysis of Variance39 Questions
Exam 26: Multifactor Analysis of Variance22 Questions
Exam 27: Multiple Regression22 Questions
Exam 28: Multiple Regression Wisdom21 Questions
Exam 29: Rank-Based Nonparametric Tests29 Questions
Exam 30: The Bootstrap27 Questions
Select questions type
A particular student has a grade point average (GPA)of 2.5 in their first three courses.What is the minimum average they will need in their fourth and fifth courses so that their overall GPA on all five courses is at least 3.0?
(Multiple Choice)
4.8/5  (32)
(32)
Here are some scores from a recent Mathematics exam: 95.5,65.9,93.2,80.6,56.8,50,86.4,54.5,40.9,77.3,79.5,10,65.9,70.5,15,77.3,81.8,12,50,79.5,60.2.Which is a better summary of the scores,the mean or the median? Explain.
(Multiple Choice)
4.9/5 (33)
Shown below are the data and summary statistics for the reading scores of 29 fifth graders. 1.3 1.5 2.1 2.5 2.7 3.1 3.4 3.6 3.7 3.8 4.1 4.2 4.3 4.5 4.6 4.7 4.7 4.8 4.8 5.1 5.1 5.2 5.3 5.4 5.4 5.6 5.6 5.8 5.9 Count Mean Median StdDev Min Max Q1 Q3 29 4.2 4.6 1.3 1.3 5.9 3.50 5.25 Write a brief summary of the performance of the fifth graders.
(Multiple Choice)
4.8/5 (24)
A class of sixth graders takes a diagnostic reading test,and the scores are reported by reading grade level.The 5-number summaries for the 20 boys and 21 girls are shown:
Boys: 4.7 5.9 6.4 7.6 7.8
Girls: 4.1 5.8 6.4 6.8 8.0
a)Which group had the highest score?
b)Which group had the greatest range?
c)Which group had the greatest interquartile range?
d)Which group's scores appear to be more skewed? Explain.
e)Which group generally did better on the test? Explain.
f)If the mean reading level for boys was 6.6 and for girls was 6.4,what is the overall mean for the class?
(Essay)
4.9/5 (38)
Here are some summary statistics for the recent English exam: lowest mean standard deviation = 8.3.Is the distribution symmetric,skewed to the left,or skewed to the right? Explain.
(Multiple Choice)
4.7/5 (36)
Here are the weights,in grams,of several snack crackers. 25.23 34.59 22.11 45.93 19.56 22.40 31.18 34.59 43.37 27.22 25.23 36.00 39.69 20.13 13.32 36.00 22.40 39.69 48.76 19.56 15.88
(Multiple Choice)
4.9/5 (35)
The test scores of 19 students are listed below.Find the interquartile range (IQR)by hand. 91 47 86 70 59
64 97 55 90 78
82 83 50 88 75
43 92 94 67
(Multiple Choice)
4.8/5 (43)
In a survey,26 voters were asked their ages.The results are shown below.Construct a histogram to represent the data (with 5 bins beginning with a lower bin limit of 19.5 and a bin width of 10).What is the approximate age at the centre?
43 56 28 63 67 66 52 48 37 51 40 60 62
66 45 21 35 49 32 53 61 53 69 31 48 59 
(Essay)
4.8/5 (39)
Here are the summary statistics for the monthly payroll for an accounting firm: lowest salary = $15,000
Mean salary = median = $25,000
Range = $60,000
IQR = $30,000
First quartile = $17,500
Standard deviation = $20,000
Do you think the distribution of salaries is symmetric,skewed to the left,or skewed to the right? Explain why.
(Multiple Choice)
4.8/5 (34)
In a survey,20 people were asked how many magazines they had purchased during the previous year.The results are shown below.Construct a histogram to represent the data.Use 4 bins with a bin width of 10,and begin with a lower bin limit of -0.5.What is the approximate amount at the centre?
6 15 3 36 25 18 12 18 5 30
24 7 0 22 33 24 19 4 12 9 
(Essay)
4.8/5 (35)
Here are the summary statistics for the monthly payroll for an accounting firm: lowest salary = ,mean salary = median = $25,000,range = $60,000,
IQR = $30,000,first quartile = standard deviation = $20,000.
Between what two values are the middle 50% of the salaries found?
(Multiple Choice)
4.7/5 (40)
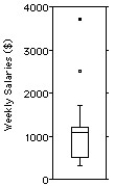
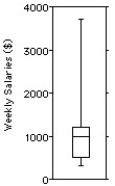
The weekly salaries (in dollars)of 24 randomly selected employees of a company are shown below.
310 320 450 460 470 500 520 540 580 600 650 700 710 840 870 900 1000 1200 1250 1300 1400 1720 2500 3700
Choose the boxplot that represents the given data.
I 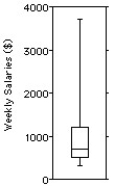 II
II  III
III
 IV
IV 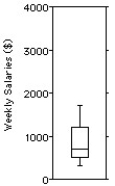 V
V
(Multiple Choice)
4.8/5 (41)
Two sections of a class took the same quiz.Section A had 15 students who had a mean score of 80,and Section B had 20 students who had a mean score of 90.Overall,what was the approximate mean score for all of the students on the quiz?
(Multiple Choice)
4.9/5 (27)
Last year,nine employees of an electronics company retired.Their ages at retirement,in years,are listed below. 55 63 64
50 60 58
67 50 50
Round your answer to the nearest tenth.
(Multiple Choice)
4.9/5 (30)
The weekly salaries (in dollars)of 24 randomly selected employees of a company are shown below,and displayed on the following boxplot. 310 320 450 460 470 500 520 540 580 600 650 700 710 840 870 900 1000 1200 1250 1300 1400 1720 2500 3700
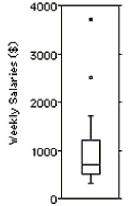 Find the IQR and the standard deviation.Which is the most appropriate measure of spread?
(Multiple Choice)
4.9/5 (40)
Which set has the largest standard deviation? Set 1 Set 2 80 110 120 130 180 10 40 50 60 110
(Multiple Choice)
4.9/5 (40)
Number of times each face of a fair six-sided die shows in 60 tosses.
(Multiple Choice)
4.8/5 (41)
The ages of the 21 members of a track and field team are listed below.Find the standard deviation. 15 18 18 19 22 23 24
24 24 25 25 26 26 27
28 28 30 32 33 40 42
(Multiple Choice)
4.8/5 (43)
The heights,in centimetres,of 18 randomly selected Grade 8 students are given below. 120 145 187 155 119 136 127 141 179 163 182 202 114 171 134 150 167 171
(Multiple Choice)
4.9/5 (33)
The normal annual precipitation (in millimetres)is given below for 21 different cities. 39.1 30.6 18.5 35.0 27.1 27.8 8.6
23.2 42.6 34.7 21.2 12.0 5.1 14.4
22.7 10.9 16.0 25.4 17.2 14.7 51.7
(Multiple Choice)
4.8/5 (33)
Filters
- Essay(0)
- Multiple Choice(0)
- Short Answer(0)
- True False(0)
- Matching(0)