Exam 17: Process Improvement Using Control Charts
Exam 1: An Introduction to Business Statistics54 Questions
Exam 2: Descriptive Statistics: Tabular and Graphical Methods90 Questions
Exam 3: Descriptive Statistics: Numerical Methods149 Questions
Exam 4: Probability135 Questions
Exam 5: Discrete Random Variables128 Questions
Exam 6: Continuous Random Variables150 Questions
Exam 7: Sampling and Sampling Distributions116 Questions
Exam 8: Confidence Intervals144 Questions
Exam 9: Hypothesis Testing148 Questions
Exam 10: Statistical Inferences Based on Two Samples132 Questions
Exam 11: Experimental Design and Analysis of Variance115 Questions
Exam 12: Chi-Square Tests96 Questions
Exam 13: Simple Linear Regression Analysis148 Questions
Exam 14: Multiple Regression122 Questions
Exam 15: Model Building and Model Diagnostics102 Questions
Exam 16: Time Series Forecasting150 Questions
Exam 17: Process Improvement Using Control Charts122 Questions
Exam 18: Nonparametric Methods97 Questions
Exam 19: Decision Theory90 Questions
Select questions type
When employing measurement data to study a process,the _______ monitors the process variation.
(Multiple Choice)
4.7/5  (43)
(43)
From 20 samples of size 100,total of 80 units is defective.What is the centerline for the p-chart?
(Multiple Choice)
4.8/5 (35)
The natural tolerance limits for a normally distributed process that is in statistical control:
(Multiple Choice)
4.9/5 (32)
If  = .0139 and 25 shipments of 20 items each were examined,what is the UCL and the LCL for the p-chart?
(Multiple Choice)
5.0/5 (36)
If a control chart is used correctly,and the necessary corrective actions are taken,as the control limits get _______,the potential quality of the product _____________.
(Multiple Choice)
4.8/5 (26)
A manufacturer of windows produces one type that has a plastic coating.The specification limits for the plastic coating are 30 and 70.From time to time the plastic coating can become uneven.Therefore,in order to keep the coating as even as possible,thickness measurements are periodically taken at four different locations on the window.15 subgroups were observed and each subgroup consists of the four thickness measurements taken across the windows at a particular time with the following results: mean of the means =  = 50.05 and the average range of 8.85. Is the process capable of meeting the specifications?
(Multiple Choice)
4.9/5 (37)
A foreman wants to use an  chart to control the average length of the bolts manufactured.He has recently collected the six samples given below.
 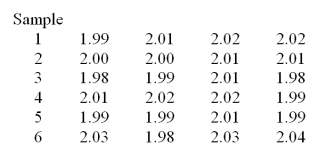 Calculate the mean of the means
  .
.
(Multiple Choice)
4.9/5 (24)
If a company is using an  chart for a given process with measurement data,it is generally not important or necessary to use an R or s chart.
(True/False)
4.8/5 (33)
Auxiliary lines drawn on a control chart for accomplishing pattern analysis are called _____ boundaries.
(Multiple Choice)
4.8/5 (45)
A control chart on which subgroup means are plotted versus time is a(n)_____ chart.
(Multiple Choice)
4.9/5 (39)
Suppose that  and R charts are based on subgroups of size four are being used to monitor the tire diameter size of a new radial tire manufactured by a tire company.The
  and R charts are found to be in statistical control with
 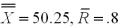 inches.A histogram of the tire diameter measurements indicates that distribution of these measurements is approximately normally distributed. If the tire diameter specifications are 50 inches 1 inch,is the process capable of meeting the specifications?
(Multiple Choice)
5.0/5 (44)
If  and R charts are used to control a manufacturing process,______ chart is analyzed first and brought into a state of statistical control before preparing the _______ chart.
(Multiple Choice)
4.8/5 (27)
A _____ is a set of process observations that are examined for the purpose of constructing control charts.
(Multiple Choice)
4.9/5 (34)
A motorcycle manufacturer produces the parts for its vehicles in different locations and transports them to it plant for assembly.In order to keep the assembly operations running efficiently,it is vital that all parts be within specification limits.One important part used in the assembly is the engine camshaft and one important quality characteristic is the case hardness depth.Specifications state that the hardness depth must be between 3.0 mm and 6.0 mm.To investigate the process,the quality control engineer selected 25 daily subgroups of n = 5 and measured the hardness depth.The process yielded a mean of the means  = 4.50 and an average range = 1.01. Find the sigma level capability of the process.
(Multiple Choice)
4.8/5 (36)
A foreman wants to use an  chart to control the average length of the bolts manufactured.He has recently collected the six samples given below.
  Calculate the average range.
(Multiple Choice)
4.7/5 (32)
A sequence of steadily increasing plot points on a control chart is referred to as a _____.
(Multiple Choice)
4.9/5 (41)
Reducing common causes of variation usually requires action by management.
(True/False)
4.8/5 (31)
A powder metal manufacturing company is producing sleeves for a locking mechanism.The target (nominal)value for the inside diameter is 1 inch.The inside diameter specifications are 1 .005 inches.Assume that the process is in statistical control with  = 1.0002 inches,
  = .003 inches and subgroup size of 5. What is the sigma level capability for this process?
(Multiple Choice)
4.9/5 (25)
In 20 samples there are a total of 80 units defective.If each sample consists of 100 units,find the appropriate UCL and the LCL for the p-chart.
(Multiple Choice)
4.9/5 (31)
A motorcycle manufacturer produces the parts for its vehicles in different locations and transports them to it plant for assembly.In order to keep the assembly operations running efficiently,it is vital that all parts be within specification limits.One important part used in the assembly is the engine camshaft and one important quality characteristic is the case hardness depth.Specifications state that the hardness depth must be between 3.0 mm and 6.0 mm.To investigate the process,the quality control engineer selected 25 daily subgroups of n = 5 and measured the hardness depth.The process yielded a mean of the means  = 4.50 and an average range = 1.01. Calculate the control limits for the X-bar chart.
(Multiple Choice)
4.8/5 (41)
Filters
- Essay(0)
- Multiple Choice(0)
- Short Answer(0)
- True False(0)
- Matching(0)