Exam 17: Process Improvement Using Control Charts
Exam 1: An Introduction to Business Statistics54 Questions
Exam 2: Descriptive Statistics: Tabular and Graphical Methods90 Questions
Exam 3: Descriptive Statistics: Numerical Methods149 Questions
Exam 4: Probability135 Questions
Exam 5: Discrete Random Variables128 Questions
Exam 6: Continuous Random Variables150 Questions
Exam 7: Sampling and Sampling Distributions116 Questions
Exam 8: Confidence Intervals144 Questions
Exam 9: Hypothesis Testing148 Questions
Exam 10: Statistical Inferences Based on Two Samples132 Questions
Exam 11: Experimental Design and Analysis of Variance115 Questions
Exam 12: Chi-Square Tests96 Questions
Exam 13: Simple Linear Regression Analysis148 Questions
Exam 14: Multiple Regression122 Questions
Exam 15: Model Building and Model Diagnostics102 Questions
Exam 16: Time Series Forecasting150 Questions
Exam 17: Process Improvement Using Control Charts122 Questions
Exam 18: Nonparametric Methods97 Questions
Exam 19: Decision Theory90 Questions
Select questions type
If  = 2.0144,
  = .0972,and 25 subgroups of size 5. Find the UCL and the LCL for the R-chart.
(Multiple Choice)
4.8/5  (36)
(36)
Suppose that  and R charts are based on subgroups of size four are being used to monitor the tire diameter size of a new radial tire manufactured by a tire company.The
  and R charts are found to be in statistical control with
 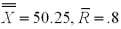 inches.A histogram of the tire diameter measurements indicates that distribution of these measurements is approximately normally distributed. Calculate the estimate of the percentage of tires that are out of specification.
(Multiple Choice)
4.9/5 (36)
Filters
- Essay(0)
- Multiple Choice(0)
- Short Answer(0)
- True False(0)
- Matching(0)