Exam 17: Process Improvement Using Control Charts
Exam 1: An Introduction to Business Statistics54 Questions
Exam 2: Descriptive Statistics: Tabular and Graphical Methods90 Questions
Exam 3: Descriptive Statistics: Numerical Methods149 Questions
Exam 4: Probability135 Questions
Exam 5: Discrete Random Variables128 Questions
Exam 6: Continuous Random Variables150 Questions
Exam 7: Sampling and Sampling Distributions116 Questions
Exam 8: Confidence Intervals144 Questions
Exam 9: Hypothesis Testing148 Questions
Exam 10: Statistical Inferences Based on Two Samples132 Questions
Exam 11: Experimental Design and Analysis of Variance115 Questions
Exam 12: Chi-Square Tests96 Questions
Exam 13: Simple Linear Regression Analysis148 Questions
Exam 14: Multiple Regression122 Questions
Exam 15: Model Building and Model Diagnostics102 Questions
Exam 16: Time Series Forecasting150 Questions
Exam 17: Process Improvement Using Control Charts122 Questions
Exam 18: Nonparametric Methods97 Questions
Exam 19: Decision Theory90 Questions
Select questions type
A sequence of steadily decreasing points on a control chart is called run down.
(True/False)
4.9/5  (36)
(36)
Sigma level capability is the number of estimated process standard deviations between the estimated process mean and the specification limit closest to the estimated process mean.
(True/False)
4.8/5 (34)
A motorcycle manufacturer produces the parts for its vehicles in different locations and transports them to it plant for assembly.In order to keep the assembly operations running efficiently,it is vital that all parts be within specification limits.One important part used in the assembly is the engine camshaft and one important quality characteristic is the case hardness depth.Specifications state that the hardness depth must be between 3.0 mm and 6.0 mm.To investigate the process,the quality control engineer selected 25 daily subgroups of n = 5 and measured the hardness depth.The process yielded a mean of the means  = 4.50 and an average range = 1.01. Calculate the center line for the R chart.
(Multiple Choice)
4.9/5 (33)
Unusual sources of variation that can be attributed to specific causes are called the common causes of process variation.
(True/False)
4.7/5 (36)
Use this information about 10 shipments of light bulbs: 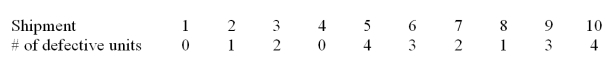 If 200 light bulbs are selected at random from each of 10 shipments and the number of defectives in each shipment is given above,find the LCL and the UCL for the p-chart.
(Multiple Choice)
4.9/5 (38)
If  = 16.1,
  = .03,and n = 6,calculate natural tolerance limits.
(Multiple Choice)
4.9/5 (40)
Assume that 25 samples of 50 each are taken and the total number of defectives is 34. Find the LCL and UCL for the p-chart.
(Multiple Choice)
5.0/5 (39)
If 20 samples of size 7 are drawn with  = 33.33 and
  = 5.65. What are the UCL and the LCL for the
  chart?
(Multiple Choice)
4.9/5 (36)
The distance between natural tolerance limits and customer specifications is called _____.
(Multiple Choice)
4.8/5 (32)
A control chart on which the proportions of nonconforming units in subgroups of size n are plotted versus time is a _____ chart.
(Multiple Choice)
4.7/5 (35)
If a manufacturing process is in statistical control,it means that the process is capable of producing products that meets the customer's needs.
(True/False)
4.9/5 (29)
A motorcycle manufacturer produces the parts for its vehicles in different locations and transports them to it plant for assembly.In order to keep the assembly operations running efficiently,it is vital that all parts be within specification limits.One important part used in the assembly is the engine camshaft and one important quality characteristic is the case hardness depth.Specifications state that the hardness depth must be between 3.0 mm and 6.0 mm.To investigate the process,the quality control engineer selected 25 daily subgroups of n = 5 and measured the hardness depth.The process yielded a mean of the means  = 4.50 and an average range = 1.01. Is the process capable of meeting the specifications?
(Multiple Choice)
4.9/5 (38)
A unit that fails to meet specifications is called a _____ unit.
(Multiple Choice)
4.9/5 (47)
A fastener company produces bolts with a nominal (target)length of 2.00 inches.The specifications are 2.00 .006 inches. If the process mean is 2.001 and the process standard deviation is .0016,determine the value of Cpk.
(Multiple Choice)
4.8/5 (37)
When employing measurement data to study a process,the ______ monitors the process mean.
(Multiple Choice)
4.9/5 (37)
If 20 samples of size 7 are drawn with  = 33.33 and
  = 5.65, What are the UCL and LCL for the R-chart?
(Multiple Choice)
4.9/5 (34)
A foreman wants to use an  chart to control the average length of the bolts manufactured.He has recently collected the six samples given below.
 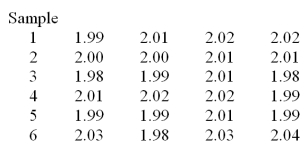 Determine the LCL and the UCL for the R chart.
(Multiple Choice)
4.9/5 (25)
If  = 16.1,
  = .03,and n = 6,and if specifications are (15.9,16.3),is the process capable?
(Multiple Choice)
4.9/5 (41)
For a manufacturing process,  = 10 inches,
  = .4 inches and the subgroup sample size is 6 units. Calculate the standard control limits for the R chart.
(Multiple Choice)
4.8/5 (30)
How well a process is able to meet the requirements set forth by the process design is called
(Multiple Choice)
4.8/5 (37)
Filters
- Essay(0)
- Multiple Choice(0)
- Short Answer(0)
- True False(0)
- Matching(0)