Exam 16: Time Series Forecasting
Exam 1: An Introduction to Business Statistics54 Questions
Exam 2: Descriptive Statistics: Tabular and Graphical Methods90 Questions
Exam 3: Descriptive Statistics: Numerical Methods149 Questions
Exam 4: Probability135 Questions
Exam 5: Discrete Random Variables128 Questions
Exam 6: Continuous Random Variables150 Questions
Exam 7: Sampling and Sampling Distributions116 Questions
Exam 8: Confidence Intervals144 Questions
Exam 9: Hypothesis Testing148 Questions
Exam 10: Statistical Inferences Based on Two Samples132 Questions
Exam 11: Experimental Design and Analysis of Variance115 Questions
Exam 12: Chi-Square Tests96 Questions
Exam 13: Simple Linear Regression Analysis148 Questions
Exam 14: Multiple Regression122 Questions
Exam 15: Model Building and Model Diagnostics102 Questions
Exam 16: Time Series Forecasting150 Questions
Exam 17: Process Improvement Using Control Charts122 Questions
Exam 18: Nonparametric Methods97 Questions
Exam 19: Decision Theory90 Questions
Select questions type
Consider a time series with 15 quarterly sales observations.Using the quadratic trend model the following partial computer output was obtained. 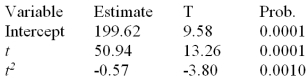 Write the prediction equation.
(Essay)
4.7/5  (38)
(38)
Consider the following data: 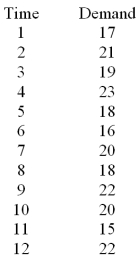 Calculate S0 using simple exponential smoothing and = 2.
(Multiple Choice)
4.8/5 (34)
Weighting in exponential smoothing is accomplished by the use of ____.
(Multiple Choice)
4.9/5 (36)
The linear trend equation for the following data is 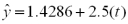
 Find the residual value (error)for period 7.
(Multiple Choice)
4.9/5 (42)
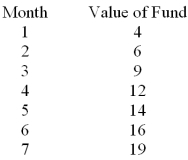
Consider the regression equation  = 6.04 + 0.10(t)and the data below.
 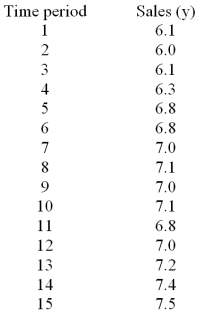 Compute the predicted value of sales for period 8.
(Multiple Choice)
4.8/5 (31)
Those fluctuations that are associated with climate,holidays and related activities are referred to as ___________ variations.
(Multiple Choice)
4.9/5 (45)
In the Durbin-Watson test,if the calculated d-statistic is greater than the upper value of the d-statistic,then
(Multiple Choice)
4.7/5 (41)
The basic difference between MAD and MSE is that MSE,unlike MAD,penalizes a forecasting technique much more for _____ errors than for _____ errors.
(Multiple Choice)
4.9/5 (36)
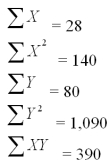
Consider the following data and calculations.Calculate the estimated value of b1 and b0 and state the linear trend regression prediction equation. 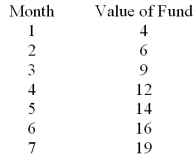
(Multiple Choice)
4.8/5 (43)
Time series decomposition method would not be used to forecast seasonal data.
(True/False)
5.0/5 (34)
When the magnitude of the seasonal swing does not depend on the level of a time series,we call this _________ variation.
(Multiple Choice)
4.8/5 (35)
Consider the following set of quarterly sales data given in thousands of dollars. 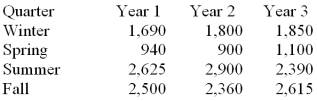 Write an appropriate dummy variable model that incorporates a linear trend and constant seasonal variation.
(Essay)
4.9/5 (34)
Cyclical variation exists when the magnitude of the seasonal swing does not depend on the level of a time series.
(True/False)
4.8/5 (30)
Dummy variable regression would be an appropriate method to use to forecast a time series that exhibits a linear trend with no seasonal or cyclical patterns.
(True/False)
4.9/5 (32)
Holt - Winter's double exponential smoothing would be an appropriate method to use to forecast a time series that exhibits a linear trend with no seasonal or cyclical patterns.
(True/False)
4.9/5 (37)
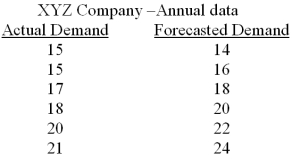 Use this equation to forecast the demand for this product and calculate the MSD.
(Multiple Choice)
4.8/5 (28)
Consider the following data and calculate S1 using simple exponential smoothing and = 0.3. 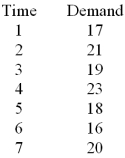
(Multiple Choice)
4.8/5 (42)
The linear regression trend model was applied to a time series of sales data based on the last 16 months of sales.The following partial computer output was obtained: 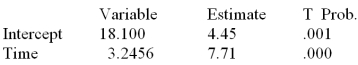 What is the predicted value of y when t = 17?
(Essay)
4.9/5 (37)
Filters
- Essay(0)
- Multiple Choice(0)
- Short Answer(0)
- True False(0)
- Matching(0)