Exam 16: Time Series Forecasting
Exam 1: An Introduction to Business Statistics54 Questions
Exam 2: Descriptive Statistics: Tabular and Graphical Methods90 Questions
Exam 3: Descriptive Statistics: Numerical Methods149 Questions
Exam 4: Probability135 Questions
Exam 5: Discrete Random Variables128 Questions
Exam 6: Continuous Random Variables150 Questions
Exam 7: Sampling and Sampling Distributions116 Questions
Exam 8: Confidence Intervals144 Questions
Exam 9: Hypothesis Testing148 Questions
Exam 10: Statistical Inferences Based on Two Samples132 Questions
Exam 11: Experimental Design and Analysis of Variance115 Questions
Exam 12: Chi-Square Tests96 Questions
Exam 13: Simple Linear Regression Analysis148 Questions
Exam 14: Multiple Regression122 Questions
Exam 15: Model Building and Model Diagnostics102 Questions
Exam 16: Time Series Forecasting150 Questions
Exam 17: Process Improvement Using Control Charts122 Questions
Exam 18: Nonparametric Methods97 Questions
Exam 19: Decision Theory90 Questions
Select questions type
Simple exponential forecasting method would not be used to forecast seasonal data.
(True/False)
4.9/5  (36)
(36)
Given the following data  Compute the total error (sum of the error terms).
(Multiple Choice)
4.8/5 (38)
When there is _______________ seasonal variation,the magnitude of the seasonal swing does not depend on the level of the time series.
(Multiple Choice)
4.8/5 (34)
The Laspeyres index and the Paasche index are both examples of _________ aggregate price indexes.
(Multiple Choice)
4.7/5 (41)
A simple index is obtained by dividing the current value of a time series by the value of a time series in the _____ time period and by multiplying this ratio by 100.
(Multiple Choice)
4.8/5 (38)
Consider the following data:  Calculate S5 using simple exponential smoothing if S3 = 19.064 and = 0.2.
(Multiple Choice)
4.9/5 (34)
The following data on prices and quantities for the years 1995 and 2000 are given for three products.  Calculate the Laspeyres index.
(Essay)
4.8/5 (41)
The linear regression trend model was applied to a time series sales data based on the last 24 months' sales.The following partial computer output was obtained.  What is the predicted value of y when t = 25?
(Essay)
4.8/5 (36)
Use the following information for the three grains.  Calculate the Laspeyres index.
(Essay)
4.8/5 (39)
The forecaster who uses MSD (mean squared deviations)to measure the effectiveness of forecasting methods would prefer method 1 that results in several smaller forecast errors to method 2 that results in one large forecast error equal to the sum of the absolute values of several small forecast errors given by method 1.
(True/False)
4.7/5 (27)
When preparing a price index based on multiple products,if the price of each product is weighted by the quantity of the product purchased in a given period of time,the resulting index is called ___________ price index.
(Multiple Choice)
4.9/5 (42)
Consider the following data and calculate S2 using simple exponential smoothing and = 0.3. 
(Multiple Choice)
4.8/5 (36)
Consider the quarterly production data (in thousands of units)for the XYZ manufacturing company below.  Calculate the 4 period (quarter)centered moving average for the entire time series.
(Essay)
4.9/5 (37)
Dummy variables are used to model increasing seasonal variation.
(True/False)
4.9/5 (39)
Since the ____________ index employs the base period quantities in all succeeding periods,it allows for ready comparisons for identical quantities of goods purchased between the base period and all succeeding periods.
(Multiple Choice)
4.7/5 (37)
Consider the following data:  Use simple exponential smoothing with = 0.2.and determine the forecast error for time period 1.
(Multiple Choice)
4.8/5 (37)
Given the following data  Compute the total error (sum of the error terms)
(Essay)
5.0/5 (37)
_______________ index is most useful if the base quantities provide a reasonable representation of consumption patterns in succeeding time periods.
(Multiple Choice)
4.9/5 (40)
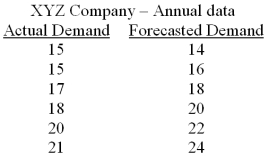 Based on the information given in the table above,what is the average forecast error?
(Multiple Choice)
4.8/5 (46)
Based on the following data,a forecaster used simple exponential smoothing and determined the following: S0 = 19,S1 = 18.6,S2 = 19.08,S3 = 19.064,S4 = 19.851 and S5 = 19.481.  Calculate the Mean Squared Deviation (MSD or MSE).
(Multiple Choice)
4.8/5 (39)
Filters
- Essay(0)
- Multiple Choice(0)
- Short Answer(0)
- True False(0)
- Matching(0)