Exam 10: Statistical Inferences Based on Two Samples
Exam 1: An Introduction to Business Statistics54 Questions
Exam 2: Descriptive Statistics: Tabular and Graphical Methods90 Questions
Exam 3: Descriptive Statistics: Numerical Methods149 Questions
Exam 4: Probability135 Questions
Exam 5: Discrete Random Variables128 Questions
Exam 6: Continuous Random Variables150 Questions
Exam 7: Sampling and Sampling Distributions116 Questions
Exam 8: Confidence Intervals144 Questions
Exam 9: Hypothesis Testing148 Questions
Exam 10: Statistical Inferences Based on Two Samples132 Questions
Exam 11: Experimental Design and Analysis of Variance115 Questions
Exam 12: Chi-Square Tests96 Questions
Exam 13: Simple Linear Regression Analysis148 Questions
Exam 14: Multiple Regression122 Questions
Exam 15: Model Building and Model Diagnostics102 Questions
Exam 16: Time Series Forecasting150 Questions
Exam 17: Process Improvement Using Control Charts122 Questions
Exam 18: Nonparametric Methods97 Questions
Exam 19: Decision Theory90 Questions
Select questions type
When testing the difference between two population proportions,__________ test statistic is used.
(Multiple Choice)
4.8/5  (26)
(26)
A fast food company uses two management-training methods.Method 1 is a traditional method of training and Method 2 is a new and innovative method.The company has just hired 31 new management trainees.15 of the trainees are randomly selected and assigned to the first method,and the remaining 16 trainees are assigned to the second training method.After three months of training,the management trainees took a standardized test.The test was designed to evaluate their performance and learning from training.The sample mean score and sample standard deviation of the two methods are given below.The management wants to determine if the company should implement the new training method. 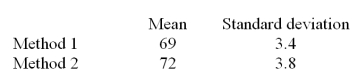 Write the alternative hypothesis.
(Multiple Choice)
4.9/5 (37)
When testing H0: 12 22 HA: 12> 22 where s12 = .004,s22 = .002,n1 = 4,n2 = 7 at = .05,what critical value do we use?
(Multiple Choice)
4.8/5 (39)
Suppose that a realtor is interested in comparing the price of midrange homes in two cities in a Midwestern state.She conducts a small survey in the two cities looking at the price of midrange homes.Assume equal population variances. 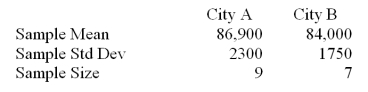 Calculate the pooled estimate of 2 (rounded to nearest hundred)
(Multiple Choice)
4.8/5 (28)
Two hospital emergency rooms use different procedures for triage of their patients.We want to test the claim that the mean waiting time of patients is the same for both hospitals.The 40 randomly selected subjects from one hospital produce a mean of 18.3 minutes.The 50 randomly selected patients from the other hospital produce a mean of 25.31 minutes.Assume a a = 2.1 minutes and b = 2.92 minutes.Setup the null hypothesis to determine if there is a difference in the mean waiting time between the two hospitals.
(Multiple Choice)
4.8/5 (28)
In a market research study conducted by a local winery on white wine preference,the following results were found.Of a sample of 500 men,120 preferred white wine and of a sample of 500 women,210 preferred white wine.Calculate the test statistic for testing the claim that women are 25% higher than men on preference for white wine.
(Multiple Choice)
4.8/5 (35)
When comparing two population means based on independent random samples,the pooled estimate of the variance is used if both population standard deviations are known.
(True/False)
4.9/5 (36)
Suppose that a realtor is interested in comparing the price of midrange homes in two cities in a Midwestern state.She conducts a small survey in the two cities looking at the price of midrange homes.Assume equal population variances. 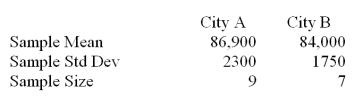 Test the claim at
  = .01 where the pooled variance = 4335357.143.
(Multiple Choice)
4.7/5 (28)
Suppose that a realtor is interested in comparing the price of midrange homes in two cities in a Midwestern state.She conducts a small survey in the two cities looking at the price of midrange homes.Assume equal population variances. 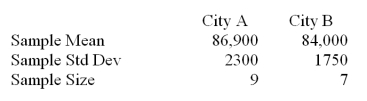 Setup the alternative hypothesis to test the claim that there is a difference in the mean price of midrange homes of the two cities.
(Multiple Choice)
4.9/5 (31)
If we are testing the difference between the means of two normally distributed independent populations with samples of n1 = 10,n2 = 10,the degrees of freedom for the t statistic is ____.
(Multiple Choice)
4.7/5 (28)
When we are testing a hypothesis about the difference in two population proportions based on large independent samples,we compute a combined (pooled)proportion from the two samples if we assume that there is no difference between the two proportions in our null hypothesis.
(True/False)
4.7/5 (30)
In testing the difference between two means from two independent populations,the sample sizes do not have to be equal to be able to use the Z statistic.
(True/False)
4.8/5 (38)
A marketing research company surveyed grocery shoppers in the east and west coasts to see the percentage of the customers who prefer chicken to other meat.The data are given below. 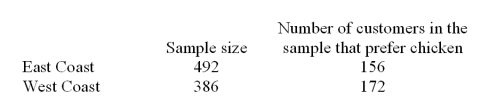 Determine the 95% confidence interval for the difference between the proportion of customers who prefer chicken at the West Coast and the proportion of customers who prefer chicken at the East Coast.
(Multiple Choice)
4.8/5 (41)
In testing the difference between the means of two independent populations,the variances of the two samples can be pooled if the population variances are assumed to be ____________.
(Multiple Choice)
4.8/5 (38)
Determine the 95% confidence interval for the difference between two population means where sample 1 has data: 16,14,19,18,19,20,15,18,17,18,and sample 2 has data: 13,19,14,17,21,14,15,10,13,15.(Assume equal population variances)
(Multiple Choice)
4.9/5 (36)
A test of spelling ability is given to a random sample of 10 students before and after they completed a spelling course.The mean score before the course was 119.60 and after the course the mean score was 130.80.The standard deviation of the difference was 16.061.Calculate a 99% confidence interval.
(Multiple Choice)
4.9/5 (30)
A fast food company uses two management-training methods.Method 1 is a traditional method of training and Method 2 is a new and innovative method.The company has just hired 31 new management trainees.15 of the trainees are randomly selected and assigned to the first method,and the remaining 16 trainees are assigned to the second training method.After three months of training,the management trainees took a standardized test.The test was designed to evaluate their performance and learning from training.The sample mean score and sample standard deviation of the two methods are given below.The management wants to determine if the company should implement the new training method. 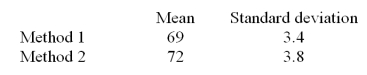 Is there evidence at = .05 to conclude that the new training method is more effective than the traditional training method?
(Multiple Choice)
4.8/5 (30)
A marketing research company surveyed grocery shoppers in the east and west coasts to see the percentage of the customers who prefer chicken to other meat.The data are given below. 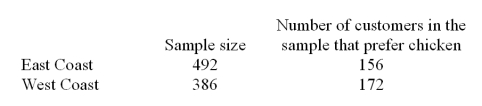 Is the proportion of customers who prefer chicken the same for the two regions? Test at = .10.
(Multiple Choice)
4.8/5 (33)
Construct a 95 percent confidence interval for 1- v2,where  1 = 34.36,
  2 = 26.45,s1 = 9,s2= 6,n1 = 10,n2 = 16.(Assume equal population variance)
(Multiple Choice)
4.7/5 (38)
Filters
- Essay(0)
- Multiple Choice(0)
- Short Answer(0)
- True False(0)
- Matching(0)