Exam 2: Descriptive Statistics: Tabular and Graphical Methods
Exam 1: An Introduction to Business Statistics54 Questions
Exam 2: Descriptive Statistics: Tabular and Graphical Methods90 Questions
Exam 3: Descriptive Statistics: Numerical Methods149 Questions
Exam 4: Probability135 Questions
Exam 5: Discrete Random Variables128 Questions
Exam 6: Continuous Random Variables150 Questions
Exam 7: Sampling and Sampling Distributions116 Questions
Exam 8: Confidence Intervals144 Questions
Exam 9: Hypothesis Testing148 Questions
Exam 10: Statistical Inferences Based on Two Samples132 Questions
Exam 11: Experimental Design and Analysis of Variance115 Questions
Exam 12: Chi-Square Tests96 Questions
Exam 13: Simple Linear Regression Analysis148 Questions
Exam 14: Multiple Regression122 Questions
Exam 15: Model Building and Model Diagnostics102 Questions
Exam 16: Time Series Forecasting150 Questions
Exam 17: Process Improvement Using Control Charts122 Questions
Exam 18: Nonparametric Methods97 Questions
Exam 19: Decision Theory90 Questions
Select questions type
A ______________ displays the frequency of each group with qualitative data and a _____________ displays the frequency of each group with quantitative data.
(Multiple Choice)
4.9/5  (35)
(35)
When developing a frequency distribution the class (group),intervals should be
(Multiple Choice)
4.8/5 (19)
Fill in the missing components of the following frequency distribution constructed for a sample size of 50. 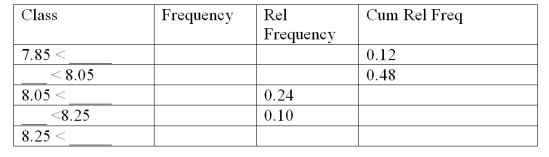
(Essay)
4.8/5 (29)
Using the following data,what would be the range of the values of the stem in a stem and leaf display? 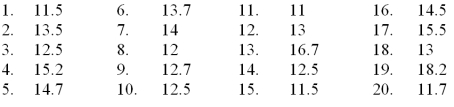
(Multiple Choice)
4.7/5 (32)
A company collected the ages from a random sample of its middle managers with the resulting frequency distribution shown below: 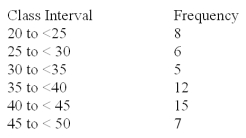 What is the relative frequency for the largest interval?
(Multiple Choice)
4.8/5 (27)
If there are 120 values in a data set,how many classes should be created for a frequency histogram?
(Multiple Choice)
4.9/5 (28)
The US local airport keeps track of the percentage of flights arriving within 15 minutes of their scheduled arrivals.The stem-and-leaf plot of the data for one year is below: 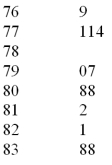 In developing a histogram of these data,how many classes would be used?
(Multiple Choice)
4.8/5 (34)
A CFO is looking at how much of a company's resources are spent on computing.He samples companies in the pharmaceutical industry and developed the following stem-and-leaf graph. 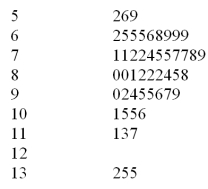 What is the smallest percent spent on R&D?
(Multiple Choice)
4.9/5 (41)
The number of weekly sales calls by a sample of 25 pharmaceutical salespersons is below:
24,56,43,35,37,27,29,44,34,28,33,28,46,31,38,41,48,38,27,29,37,33,31,40,50
Construct an Ogive plot
(Essay)
4.9/5 (33)
A(n)___________ is a graphical display of categorical data made up of vertical or horizontal bars.
(Multiple Choice)
4.8/5 (40)
A CFO is looking at how much of a company's resources are spent on computing.He samples companies in the pharmaceutical industry and developed the following stem-and-leaf graph. 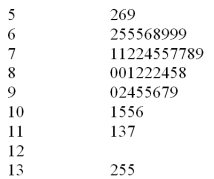 What is the approximate shape of the distribution of the data?
(Multiple Choice)
4.8/5 (29)
A CFO is looking at how much of a company's resources are spent on computing.He samples companies in the pharmaceutical industry and developed the following stem-and-leaf graph. 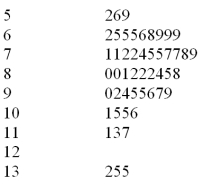 What would be the class length that would be used in creating a frequency histogram?
(Multiple Choice)
4.9/5 (31)
The local electronics retailer has recently conducted a study on purchasers of large screen televisions.The study recorded the type of television and the credit account balance of the customer at the time of purchase.The following results were obtained: 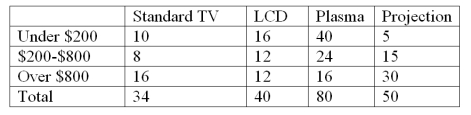 What percentage of purchases were Plasma televisions by customers with the smallest credit balances?
(Multiple Choice)
4.9/5 (33)
All of the following are used to describe quantitative data except the
(Multiple Choice)
5.0/5 (32)
Stem-and-leaf displays and dot plots are useful for detecting outliers.
(True/False)
4.8/5 (39)
A stem-and-leaf display is a graphical portrayal of a data set that shows the data set's overall pattern of variation.
(True/False)
5.0/5 (39)
Filters
- Essay(0)
- Multiple Choice(0)
- Short Answer(0)
- True False(0)
- Matching(0)