Exam 2: Descriptive Statistics: Tabular and Graphical Methods
Exam 1: An Introduction to Business Statistics54 Questions
Exam 2: Descriptive Statistics: Tabular and Graphical Methods90 Questions
Exam 3: Descriptive Statistics: Numerical Methods149 Questions
Exam 4: Probability135 Questions
Exam 5: Discrete Random Variables128 Questions
Exam 6: Continuous Random Variables150 Questions
Exam 7: Sampling and Sampling Distributions116 Questions
Exam 8: Confidence Intervals144 Questions
Exam 9: Hypothesis Testing148 Questions
Exam 10: Statistical Inferences Based on Two Samples132 Questions
Exam 11: Experimental Design and Analysis of Variance115 Questions
Exam 12: Chi-Square Tests96 Questions
Exam 13: Simple Linear Regression Analysis148 Questions
Exam 14: Multiple Regression122 Questions
Exam 15: Model Building and Model Diagnostics102 Questions
Exam 16: Time Series Forecasting150 Questions
Exam 17: Process Improvement Using Control Charts122 Questions
Exam 18: Nonparametric Methods97 Questions
Exam 19: Decision Theory90 Questions
Select questions type
When looking at the shape of the distribution using a stem-and-leaf,a distribution is skewed to the right when the left tail is shorter than the right tail.
(True/False)
4.9/5  (34)
(34)
The number of measurements falling within a class interval is called the _____.
(Multiple Choice)
4.9/5 (39)
The local electronics retailer has recently conducted a study on purchasers of large screen televisions.The study recorded the type of television and the credit account balance of the customer at the time of purchase.The following results were obtained: 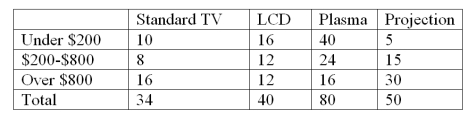 Construct a table of column percentages.
(Essay)
4.8/5 (27)
The number of items rejected daily by a manufacturer because of defects for the last 30 days are: 20,21,8,17,22,19,18,19,14,17,11,6,21,25,4,19,9,12,16,16,10,28,24,6,21,20,25,5,17,8 How many classes should be used in the construction of a histogram?
(Multiple Choice)
4.8/5 (36)
822 customers were randomly selected from those who had recently bought a book over the internet.The chart below shows the breakdown of the classification of the book type: 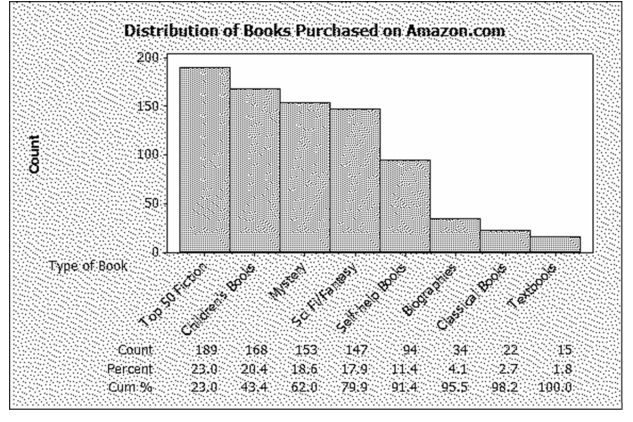 What percentage of the books purchased were self-help books?
(Multiple Choice)
4.7/5 (28)
Math test anxiety can be found throughout the general population.A study of 116 seniors at a local high school was conducted.The following table was produced from the data.Complete the missing parts. 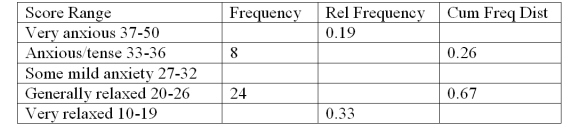
(Essay)
4.8/5 (30)
Recently an advertising company called 200 people and asked to identify the company that was in an ad running nationwide.The following results were obtained: 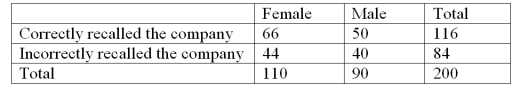 Construct a table of row percentages
(Essay)
4.9/5 (32)
Recently an advertising company called 200 people and asked to identify the company that was in an ad running nationwide.The following results were obtained: 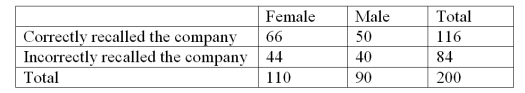 Construct a table of column percentages
(Essay)
4.8/5 (39)
The following is a partial relative frequency distribution of grades in an introductory statistics course. 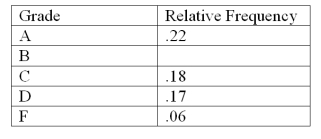 Find the relative frequency for B grade
(Multiple Choice)
4.8/5 (32)
A relative frequency curve having a long tail to the right is said to be _____.
(Multiple Choice)
5.0/5 (32)
A company collected the ages from a random sample of its middle managers with the resulting frequency distribution shown below: 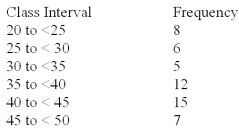 What is the midpoint of the third class interval?
(Multiple Choice)
4.8/5 (29)
The following is a relative frequency distribution of grades in an introductory statistics course. 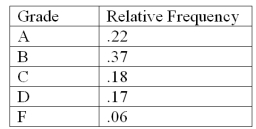 If we wish to depict these data using a pie chart,find how many degrees (out of 360 degrees)should be assigned to each grade.
(Essay)
4.9/5 (30)
Recently an advertising company called 200 people and asked to identify the company that was in an ad running nationwide.The following results were obtained: 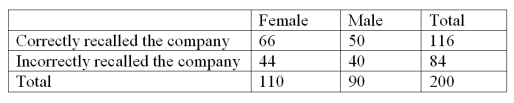 What percentage of those surveyed could not correctly recall the company?
(Multiple Choice)
4.9/5 (43)
A ______________ can be used to differentiate the "vital few" causes of quality problems from the "trivial many" causes of quality problems.
(Multiple Choice)
4.9/5 (37)
The local electronics retailer has recently conducted a study on purchasers of large screen televisions.The study recorded the type of television and the credit account balance of the customer at the time of purchase.The following results were obtained: 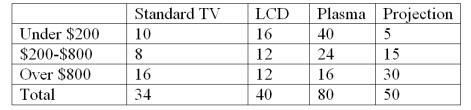 Construct a table of row percentages.
(Essay)
5.0/5 (33)
The following is a relative frequency distribution of grades in an introductory statistics course. 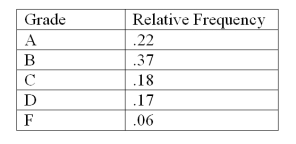 If this was the distribution of 200 students,find the frequency for the highest two grades:
(Multiple Choice)
4.8/5 (36)
The number of weekly sales calls by a sample of 25 pharmaceutical salespersons is below: 24,56,43,35,37,27,29,44,34,28,33,28,46,31,38,41,48,38,27,29,37,33,31,40,50
What is the shape of the distribution of the data?
(Multiple Choice)
4.8/5 (33)
The number of weekly sales calls by a sample of 25 pharmaceutical salespersons is below: 24,56,43,35,37,27,29,44,34,28,33,28,46,31,38,41,48,38,27,29,37,33,31,40,50
Construct a stem-and-leaf plot.
(Essay)
4.9/5 (33)
Filters
- Essay(0)
- Multiple Choice(0)
- Short Answer(0)
- True False(0)
- Matching(0)