Exam 2: Descriptive Statistics: Tabular and Graphical Methods
Exam 1: An Introduction to Business Statistics54 Questions
Exam 2: Descriptive Statistics: Tabular and Graphical Methods90 Questions
Exam 3: Descriptive Statistics: Numerical Methods149 Questions
Exam 4: Probability135 Questions
Exam 5: Discrete Random Variables128 Questions
Exam 6: Continuous Random Variables150 Questions
Exam 7: Sampling and Sampling Distributions116 Questions
Exam 8: Confidence Intervals144 Questions
Exam 9: Hypothesis Testing148 Questions
Exam 10: Statistical Inferences Based on Two Samples132 Questions
Exam 11: Experimental Design and Analysis of Variance115 Questions
Exam 12: Chi-Square Tests96 Questions
Exam 13: Simple Linear Regression Analysis148 Questions
Exam 14: Multiple Regression122 Questions
Exam 15: Model Building and Model Diagnostics102 Questions
Exam 16: Time Series Forecasting150 Questions
Exam 17: Process Improvement Using Control Charts122 Questions
Exam 18: Nonparametric Methods97 Questions
Exam 19: Decision Theory90 Questions
Select questions type
Which one of the following statistical tools is used with quantitative data?
(Multiple Choice)
4.8/5  (37)
(37)
All of the following are used to describe qualitative data except the:
(Multiple Choice)
4.9/5 (35)
Consider the following data on distances traveled by people to visit the local amusement park. 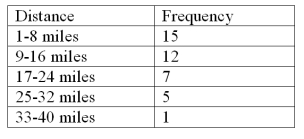 Construct an Ogive plot that corresponds to the frequency table.
(Essay)
4.7/5 (35)
Consider the following data on distances traveled by people to visit the local amusement park and calculate the relative frequency for the distances over 24 miles. 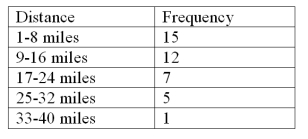
(Multiple Choice)
4.9/5 (38)
When we wish to summarize the proportion (or fraction)of items in a class we use the frequency distribution for each class.
(True/False)
4.8/5 (38)
822 customers were randomly selected from those who had recently bought a book over the internet.The chart below shows the breakdown of the classification of the book type: 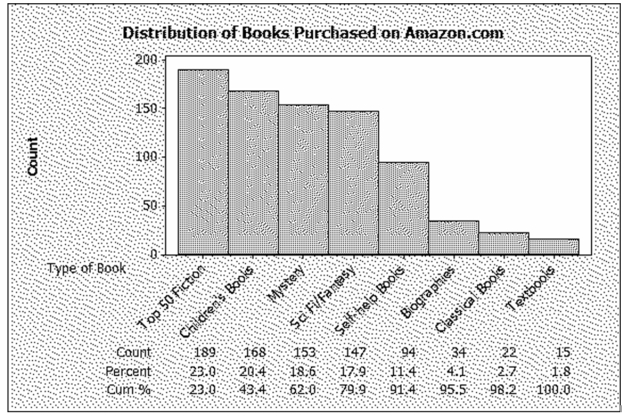 What percentage of the books purchased were either mystery or science fiction/fantasy?
(Multiple Choice)
4.9/5 (25)
The number of items rejected daily by a manufacturer because of defects for the last 30 days are: 20,21,8,17,22,19,18,19,14,17,11,6,21,25,4,19,9,12,16,16,10,28,24,6,21,20,25,5,17,8
Complete this frequency table for these data 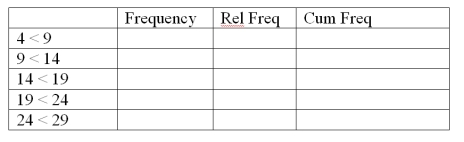
(Essay)
4.9/5 (34)
The relative frequency is the frequency of a class divided by the total number of measurements.
(True/False)
4.9/5 (32)
The number of items rejected daily by a manufacturer because of defects for the last 30 days are: 20,21,8,17,22,19,18,19,14,17,11,6,21,25,4,19,9,12,16,16,10,28,24,6,21,20,25,5,17,8
Construct a stem-and-leaf plot.
(Essay)
4.8/5 (33)
Filters
- Essay(0)
- Multiple Choice(0)
- Short Answer(0)
- True False(0)
- Matching(0)