Exam 2: Descriptive Statistics: Tabular and Graphical Methods
Exam 1: An Introduction to Business Statistics54 Questions
Exam 2: Descriptive Statistics: Tabular and Graphical Methods90 Questions
Exam 3: Descriptive Statistics: Numerical Methods149 Questions
Exam 4: Probability135 Questions
Exam 5: Discrete Random Variables128 Questions
Exam 6: Continuous Random Variables150 Questions
Exam 7: Sampling and Sampling Distributions116 Questions
Exam 8: Confidence Intervals144 Questions
Exam 9: Hypothesis Testing148 Questions
Exam 10: Statistical Inferences Based on Two Samples132 Questions
Exam 11: Experimental Design and Analysis of Variance115 Questions
Exam 12: Chi-Square Tests96 Questions
Exam 13: Simple Linear Regression Analysis148 Questions
Exam 14: Multiple Regression122 Questions
Exam 15: Model Building and Model Diagnostics102 Questions
Exam 16: Time Series Forecasting150 Questions
Exam 17: Process Improvement Using Control Charts122 Questions
Exam 18: Nonparametric Methods97 Questions
Exam 19: Decision Theory90 Questions
Select questions type
The US local airport keeps track of the percentage of flights arriving within 15 minutes of their scheduled arrivals.The stem-and-leaf plot of the data for one year is below: 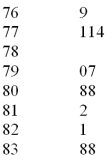 What would be the class length for creating the frequency histogram?
(Multiple Choice)
5.0/5  (36)
(36)
822 customers were randomly selected from those who had recently bought a book over the internet.The chart below shows the breakdown of the classification of the book type: 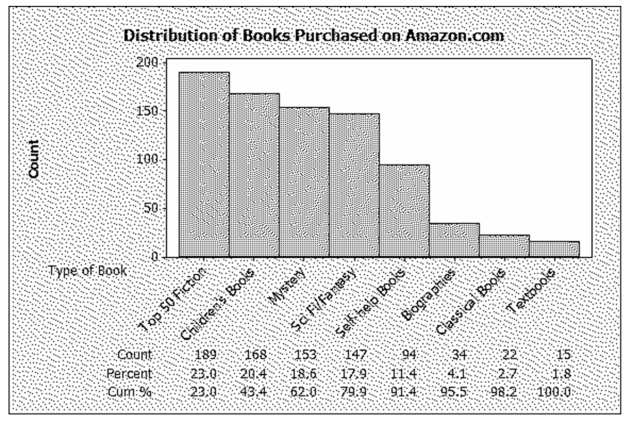 What percentages of books were in the top two categories?
(Multiple Choice)
4.9/5 (34)
If there are 30 values in a data set,how many classes should be created for a frequency histogram?
(Multiple Choice)
4.8/5 (32)
Consider the following data: 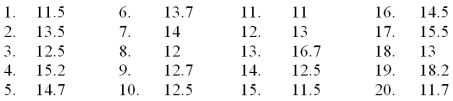 Create a stem and leaf display for the sample.
Stem and leaf of C1,N = 20 Leaf Unit = 0.10
Create a stem and leaf display for the sample.
Stem and leaf of C1,N = 20 Leaf Unit = 0.10
(Essay)
4.8/5 (40)
The 550 students answered an additional question with the following results based on their rating of their instructor: 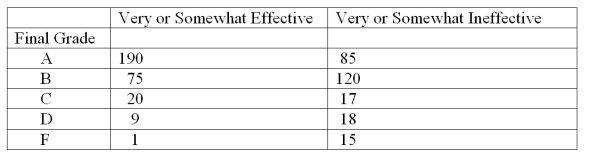 What proportion of all 550 students received less than a C?
(Multiple Choice)
4.8/5 (34)
The following is a relative frequency distribution of grades in an introductory statistics course. 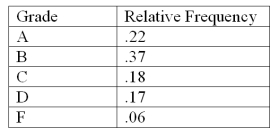 If this was the distribution of 200 students,give the frequency distribution for this data:
(Essay)
4.9/5 (27)
A histogram that tails out towards smaller values is _____.
(Multiple Choice)
4.9/5 (42)
The number of weekly sales calls by a sample of 25 pharmaceutical salespersons is below: 24,56,43,35,37,27,29,44,34,28,33,28,46,31,38,41,48,38,27,29,37,33,31,40,50
How many classes should be used in the construction of a histogram?
(Multiple Choice)
4.8/5 (29)
Using the following data,describe the shape of the data distribution. 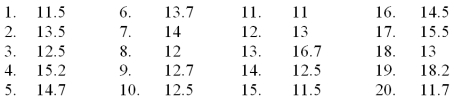
(Multiple Choice)
4.7/5 (33)
Recently an advertising company called 200 people and asked to identify the company that was in an ad running nationwide.The following results were obtained: 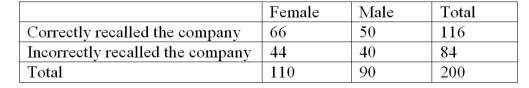 What percentage of those surveyed were female and could not recall the company?
(Multiple Choice)
4.8/5 (44)
A graphical portrayal of a data set that divides the data into classes and gives the frequency of each class is a(n)_____.
(Multiple Choice)
4.8/5 (36)
________ can be used to study the relationship between two variables.
(Multiple Choice)
4.9/5 (37)
The US local airport keeps track of the percentage of flights arriving within 15 minutes of their scheduled arrivals.The stem-and-leaf plot of the data for one year is below: 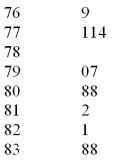 How many flights were used in this plot?
(Multiple Choice)
4.8/5 (35)
A company collected the ages from a random sample of its middle managers with the resulting frequency distribution shown below: 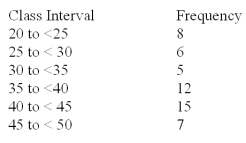 What would be the approximate shape of the relative frequency histogram?
(Multiple Choice)
4.7/5 (46)
The 550 students answered an additional question with the following results based on their rating of their instructor: 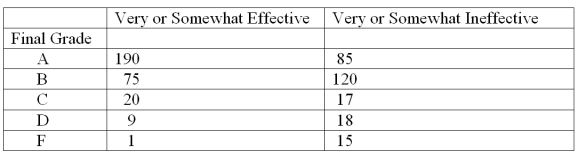 What proportion of the students who rated their instructor as very or somewhat effective received a B or better in the class?
(Multiple Choice)
4.8/5 (34)
The following is a relative frequency distribution of grades in an introductory statistics course. 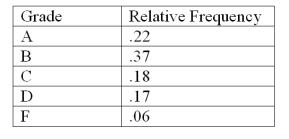 If this was the distribution of 200 students,find the frequency of failures:
(Multiple Choice)
4.8/5 (34)
The number of weekly sales calls by a sample of 25 pharmaceutical salespersons is below:
24,56,43,35,37,27,29,44,34,28,33,28,46,31,38,41,48,38,27,29,37,33,31,40,50
Construct a histogram
(Essay)
4.9/5 (27)
Filters
- Essay(0)
- Multiple Choice(0)
- Short Answer(0)
- True False(0)
- Matching(0)