Exam 14: Regression Analysis
Exam 1: Statistics and Data68 Questions
Exam 2: Tabular and Graphical Methods99 Questions
Exam 3: Numerical Descriptive Measures123 Questions
Exam 4: Basic Probability Concepts107 Questions
Exam 5: Discrete Probability Distributions118 Questions
Exam 6: Continuous Probability Distributions114 Questions
Exam 7: Sampling and Sampling Distributions110 Questions
Exam 8: Interval Estimation111 Questions
Exam 9: Hypothesis Testing111 Questions
Exam 10: Statistical Inference Concerning Two Populations104 Questions
Exam 11: Statistical Inference Concerning Variance96 Questions
Exam 12: Chi-Square Tests100 Questions
Exam 13: Analysis of Variance89 Questions
Exam 14: Regression Analysis116 Questions
Exam 15: Inference With Regression Models117 Questions
Exam 16: Regression Models for Nonlinear Relationships95 Questions
Exam 17: Regression Models With Dummy Variables117 Questions
Exam 18: Time Series and Forecasting103 Questions
Exam 19: Returns, Index Numbers and Inflation98 Questions
Exam 20: Nonparametric Tests99 Questions
Select questions type
In the simple linear regression model,β0 is the y-intercept of the line  .
.
(True/False)
4.8/5  (36)
(36)
Exhibit 14-8.An real estate analyst believes that the three main factors that influence an apartment's rent in a college town are the number of bedrooms,the number of bathrooms,and the apartment's square footage.For 40 apartments,she collects data on the rent (y,in $),the number of bedrooms (x1),the number of bathrooms (x2),and its square footage (x3).She estimates the following model:  .The following table shows a portion of the regression results.
 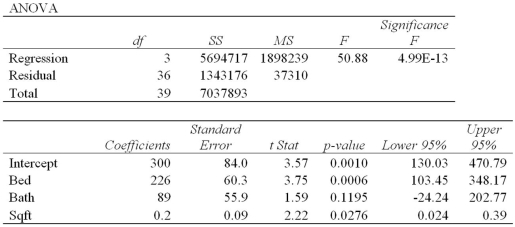 Refer to Exhibit 14-8.The slope coefficient attached to Bed indicates that,holding other explanatory variables constant,
(Multiple Choice)
4.8/5 (37)
If two linear regression models have the same number of explanatory variables,a model with an R2 value of 0.45 is a better prediction model than a model with an R2 value of 0.65.
(True/False)
4.8/5 (39)
Exhibit 14-10.A sociologist examines the relationship between the poverty rate and several socioeconomic factors.For the 50 states and the District of Columbia (n = 51),he collects data on the poverty rate (y,in %),the percent of the population with at least a high school education (x1),median income (x2,in $1000s),and the mortality rate per 1,000 residents (x3).He estimates the following model:  .The following table shows a portion of the regression results.
 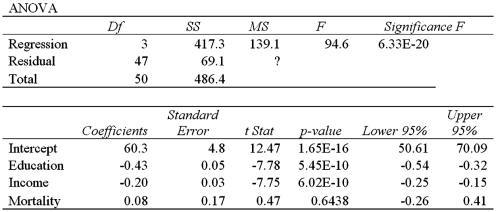 Notes: Data obtained from the Statistical Abstract of the US for the year 2007. Refer to Exhibit 14-10.What is the poverty rate for a state where 85% of the population has at least a high school education,the median income is $50,000,and the mortality rate is 10 per 1000 residents?
(Multiple Choice)
4.9/5 (42)
Consider the sample regression equation: 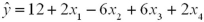 .When x1 increases 1 unit and x2 increases 2 units,while x3 and x4 remain unchanged,what change would you expect in the predicted y?
(Multiple Choice)
4.8/5 (35)
The variance of the rates of return is 0.25 for stock X and 0.01 for stock Y.The covariance between the returns of X and Y is -0.01.The correlation of the rates of return between X and Y is:
(Multiple Choice)
4.8/5 (41)
Exhibit 14-6.A manager at a local bank analyzed the relationship between monthly salary (y,in $)and length of service (x,measured in months)for 30 employees.She estimates 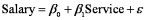 .The following table summarizes a portion of the regression results:
 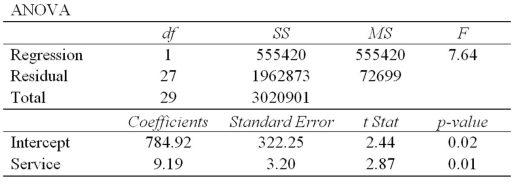 Refer to Exhibit 14-6.The standard error of the estimate is
(Multiple Choice)
4.8/5 (39)
Exhibit 14-9.When estimating  ,the following regression results were obtained.
 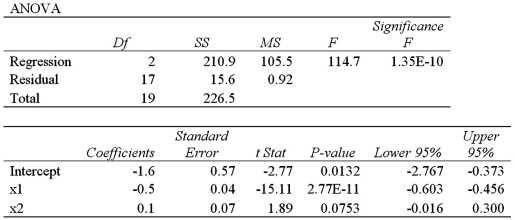 Refer to Exhibit 14-9.What is the coefficient of determination?
(Multiple Choice)
4.8/5 (32)
The sample standard deviations for x and y are 10 and 15,respectively.The covariance between x and y is -300.The correlation coefficient between x and y is:
(Multiple Choice)
4.9/5 (33)
The value 0.35 of a sample correlation coefficient indicates a weaker linear relationship than that of -0.40.
(True/False)
4.7/5 (28)
Calculate the value of  given the ANOVA portion of the following regression output:
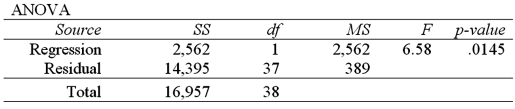
(Multiple Choice)
4.9/5 (41)
Consider the sample regression equation: 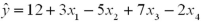 .When x1 increases 1 unit and x2 increases 2 units,while x3 and x4 remain unchanged,what change would you expect in the predicted y?
(Multiple Choice)
4.8/5 (40)
The following scatterplot implies that the relationship between the two variables x and y is: 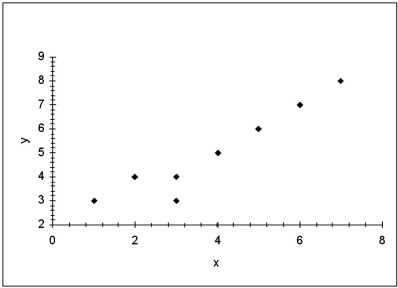
(Multiple Choice)
4.7/5 (41)
In a simple linear regression model,if the plots on a scatter diagram lie on a straight line,what is the coefficient of determination?
(Multiple Choice)
5.0/5 (25)
Consider the following simple linear regression model: 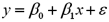 .The response variable is:
(Multiple Choice)
4.9/5 (44)
Exhibit 14-4.Consider the following sample regression equation  ,where y is the supply for Product A (in 1000s)and x is the price of Product A (in $). Refer to Exhibit 14-4.If the price of Product A increases by $3,then we expect the supply for Product A to
(Multiple Choice)
4.9/5 (41)
An analyst examines the effect that various variables have on crop yield.He estimates  where y is the average yield in bushels per acre,x1 is the amount of summer rainfall,x2 is the average daily use in machine hours of tractors on the farm,and x3 is the amount of fertilizer used per acre.The results of the regression are:
 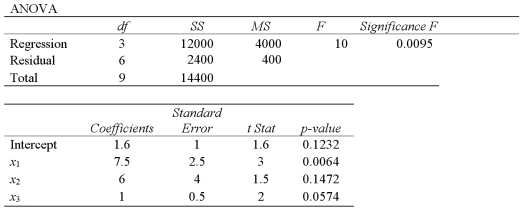 A)Predict the crop yield per acre if x1 is 5,x2 is 4,and x3 is the 0.5.
B)Calculate the standard deviation of the difference between the actual crop yield and the estimate of the crop yield.
C)How much of the variation in crop yield is unexplained by the model?
A)Predict the crop yield per acre if x1 is 5,x2 is 4,and x3 is the 0.5.
B)Calculate the standard deviation of the difference between the actual crop yield and the estimate of the crop yield.
C)How much of the variation in crop yield is unexplained by the model?
(Essay)
4.9/5 (36)
Filters
- Essay(0)
- Multiple Choice(0)
- Short Answer(0)
- True False(0)
- Matching(0)