Exam 14: Regression Analysis
Exam 1: Statistics and Data68 Questions
Exam 2: Tabular and Graphical Methods99 Questions
Exam 3: Numerical Descriptive Measures123 Questions
Exam 4: Basic Probability Concepts107 Questions
Exam 5: Discrete Probability Distributions118 Questions
Exam 6: Continuous Probability Distributions114 Questions
Exam 7: Sampling and Sampling Distributions110 Questions
Exam 8: Interval Estimation111 Questions
Exam 9: Hypothesis Testing111 Questions
Exam 10: Statistical Inference Concerning Two Populations104 Questions
Exam 11: Statistical Inference Concerning Variance96 Questions
Exam 12: Chi-Square Tests100 Questions
Exam 13: Analysis of Variance89 Questions
Exam 14: Regression Analysis116 Questions
Exam 15: Inference With Regression Models117 Questions
Exam 16: Regression Models for Nonlinear Relationships95 Questions
Exam 17: Regression Models With Dummy Variables117 Questions
Exam 18: Time Series and Forecasting103 Questions
Exam 19: Returns, Index Numbers and Inflation98 Questions
Exam 20: Nonparametric Tests99 Questions
Select questions type
A manager at a ski resort in Vermont wanted to determine the effect that weather had on its sales of lift tickets.The manager of the resort collected data over the last 20 years on the number of lift tickets sold during Christmas week (y),the total snowfall in inches (x1),and the average temperature in degrees Fahrenheit (x2).The results of the regression are: 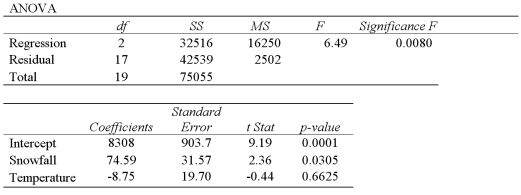 A)Predict the number of lift tickets sold if during Christmas week,the total snowfall was 25 inches and the average temperature was 35 degrees Fahrenheit.
B)Interpret the slope coefficient attached to Snowfall.
C)Calculate the standard deviation of the difference between the actual number of tickets sold and the estimate of the number of tickets sold.
D)Calculate and interpret the coefficient of determination.
E)Calculate the adjusted R2.
A)Predict the number of lift tickets sold if during Christmas week,the total snowfall was 25 inches and the average temperature was 35 degrees Fahrenheit.
B)Interpret the slope coefficient attached to Snowfall.
C)Calculate the standard deviation of the difference between the actual number of tickets sold and the estimate of the number of tickets sold.
D)Calculate and interpret the coefficient of determination.
E)Calculate the adjusted R2.
(Essay)
4.9/5  (37)
(37)
The R2 of a multiple regression of y on x1 and x2 measures the
(Multiple Choice)
4.9/5 (46)
Exhibit 14-4.Consider the following sample regression equation  ,where y is the supply for Product A (in 1000s)and x is the price of Product A (in $). Refer to Exhibit 14-4.If the price of Product A is $5,then we expect supply to be
(Multiple Choice)
4.9/5 (26)
The value -0.75 of a sample correlation coefficient indicates a stronger linear relationship than that of 0.60.
(True/False)
4.7/5 (33)
A portfolio manager is interested in reducing the risk of a particular portfolio by including assets that have little,if any,correlation.He wonders whether the stock prices for the firms Apple and Google are correlated.As a very preliminary step,he collects the monthly closing stock price for each firm from January 2012 to April 2012. 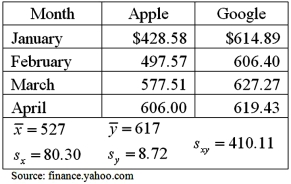 a.Compute the sample correlation coefficient.
B)Specify the competing hypotheses in order to determine whether the stock prices are correlated.
C)Calculate the value of the test statistic and approximate the corresponding p-value.
D)At the 5% significance level,what is the conclusion to the test? Explain.
a.Compute the sample correlation coefficient.
B)Specify the competing hypotheses in order to determine whether the stock prices are correlated.
C)Calculate the value of the test statistic and approximate the corresponding p-value.
D)At the 5% significance level,what is the conclusion to the test? Explain.
(Essay)
4.9/5 (28)
Exhibit 14-5.An marketing analyst wants to examine the relationship between sales (in $1,000s)and advertising (in $100s)for firms in the food and beverage industry and collects monthly data for 25 firms.He estimates the model  .The following table below shows a portion of the regression results.
 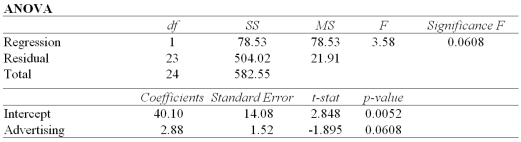 Refer to Exhibit 14-5.Calculate the coefficient of determination.
(Multiple Choice)
4.9/5 (33)
In the estimation of a multiple regression model with four explanatory variables and 25 observations,  and
and  .What is the value of R2?
(Multiple Choice)
4.9/5 (29)
Covariance can be used to determine if the linear relationship between two variables is positive or negative.
(True/False)
4.9/5 (31)
Exhibit 14-3.Consider the following sample regression equation  ,where y is the demand for Product A (in 1000s)and x is the price of the product (in $). Refer to Exhibit 14-3.If the price of the good increases by $3,then we expect demand for Product A to
(Multiple Choice)
4.7/5 (31)
The following ANOVA table was obtained when estimating a multiple regression model. 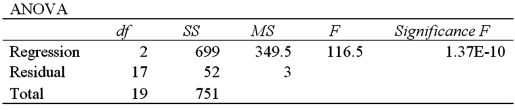 a.Calculate the standard error of the estimate.
B)Calculate the coefficient of determination.
C)Calculate adjusted R2.
a.Calculate the standard error of the estimate.
B)Calculate the coefficient of determination.
C)Calculate adjusted R2.
(Essay)
4.9/5 (28)
Exhibit 14-2.A statistics student is asked to estimate  .She calculates the following values.
  Refer to Exhibit 14-2.What is y if x equals 2?
(Multiple Choice)
4.9/5 (37)
Consider the following simple linear regression model: 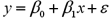 ;β0 and β1 are:
(Multiple Choice)
4.7/5 (31)
When estimating a multiple regression model,the following portion of output is obtained: 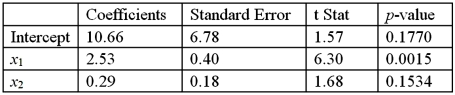 a.What is the sample regression equation?
B)Interpret the slope coefficient for x1.
C)Find the predicted value for y if x1 equals 22 and x2 equals 41.
a.What is the sample regression equation?
B)Interpret the slope coefficient for x1.
C)Find the predicted value for y if x1 equals 22 and x2 equals 41.
(Essay)
4.9/5 (28)
Exhibit 14-2.A statistics student is asked to estimate 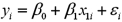 .She calculates the following values.
 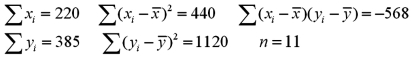 Refer to Exhibit 14-2.Calculate b1.
(Multiple Choice)
4.7/5 (34)
The following portion of regression results was obtained when estimating a simple linear regression model. 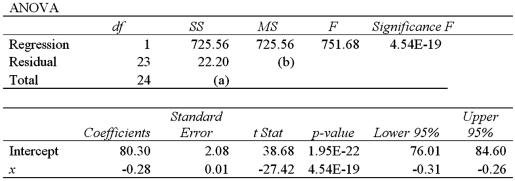 a.What is the sample regression equation?
B)Interpret the slope coefficient for x1.
C)Find the predicted value for y if x1 equals 200.
D)Fill in the missing values in the ANOVA table.
E)Calculate the standard error of the estimate.
F)Calculate R2.
a.What is the sample regression equation?
B)Interpret the slope coefficient for x1.
C)Find the predicted value for y if x1 equals 200.
D)Fill in the missing values in the ANOVA table.
E)Calculate the standard error of the estimate.
F)Calculate R2.
(Essay)
4.8/5 (29)
Exhibit 14-9.When estimating 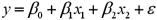 ,the following regression results were obtained.
 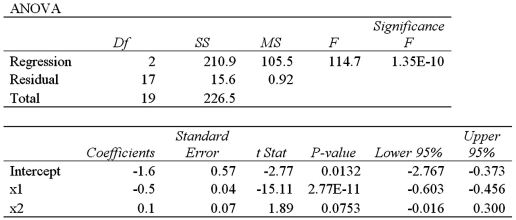 Refer to Exhibit 14-9.Predict y if
  and
and  .
.
(Multiple Choice)
4.9/5 (30)
A regression equation was estimated as 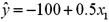 .If
.If  ,the predicted value of y is:
(Multiple Choice)
4.7/5 (47)
Exhibit 14-7.Assume you ran a multiple regression to gain a better understanding of the relationship between lumber sales,housing starts,and commercial construction.The regression uses lumber sales (in $100,000s)as the response variable with housing starts (in 1000s)and commercial construction (in 1000s)as the explanatory variables.The results of the regression are: 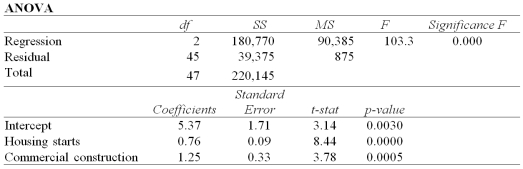 Refer to Exhibit 14-7.The explanatory variables (housing starts and commercial construction)together explained approximately _____% of the variations in the response variable (lumber sales).
(Multiple Choice)
4.8/5 (37)
The following portion of regression results was obtained when estimating a multiple regression model. 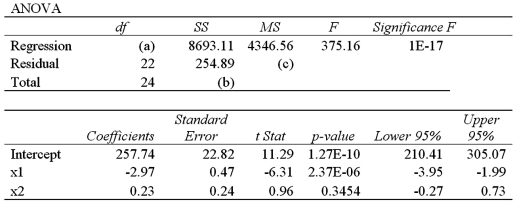 a.What is the sample regression equation?
B)Interpret the slope coefficient for x1.
C)Find the predicted value for y if x1 equals 25 and x2 equals 50.
D)Fill in the missing values in the ANOVA table.
E)Calculate the standard error of the estimate.
F)Calculate R2.
a.What is the sample regression equation?
B)Interpret the slope coefficient for x1.
C)Find the predicted value for y if x1 equals 25 and x2 equals 50.
D)Fill in the missing values in the ANOVA table.
E)Calculate the standard error of the estimate.
F)Calculate R2.
(Essay)
4.9/5 (32)
Filters
- Essay(0)
- Multiple Choice(0)
- Short Answer(0)
- True False(0)
- Matching(0)