Exam 14: Regression Analysis
Exam 1: Statistics and Data68 Questions
Exam 2: Tabular and Graphical Methods99 Questions
Exam 3: Numerical Descriptive Measures123 Questions
Exam 4: Basic Probability Concepts107 Questions
Exam 5: Discrete Probability Distributions118 Questions
Exam 6: Continuous Probability Distributions114 Questions
Exam 7: Sampling and Sampling Distributions110 Questions
Exam 8: Interval Estimation111 Questions
Exam 9: Hypothesis Testing111 Questions
Exam 10: Statistical Inference Concerning Two Populations104 Questions
Exam 11: Statistical Inference Concerning Variance96 Questions
Exam 12: Chi-Square Tests100 Questions
Exam 13: Analysis of Variance89 Questions
Exam 14: Regression Analysis116 Questions
Exam 15: Inference With Regression Models117 Questions
Exam 16: Regression Models for Nonlinear Relationships95 Questions
Exam 17: Regression Models With Dummy Variables117 Questions
Exam 18: Time Series and Forecasting103 Questions
Exam 19: Returns, Index Numbers and Inflation98 Questions
Exam 20: Nonparametric Tests99 Questions
Select questions type
A sociologist studies the relationship between a district's average score on a standardized test for 10th grade students (y),the average school expenditures per student (x1 in $1000s),and an index of the socioeconomic status of the district (x2).The results of the regression are: 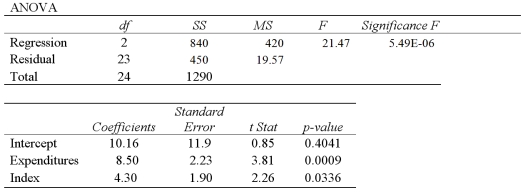 A)Predict a district's average test score if average expenditures are $4,500 and the district's social index is 8.
B)Interpret the slope coefficient attached to Expenditures.
C)Calculate the standard error of the estimate.
D)Calculate and interpret the coefficient of determination.
E)Calculate the adjusted
A)Predict a district's average test score if average expenditures are $4,500 and the district's social index is 8.
B)Interpret the slope coefficient attached to Expenditures.
C)Calculate the standard error of the estimate.
D)Calculate and interpret the coefficient of determination.
E)Calculate the adjusted  .
.
(Essay)
4.7/5  (36)
(36)
Exhibit 14-8.An real estate analyst believes that the three main factors that influence an apartment's rent in a college town are the number of bedrooms,the number of bathrooms,and the apartment's square footage.For 40 apartments,she collects data on the rent (y,in $),the number of bedrooms (x1),the number of bathrooms (x2),and its square footage (x3).She estimates the following model:  .The following table shows a portion of the regression results.
 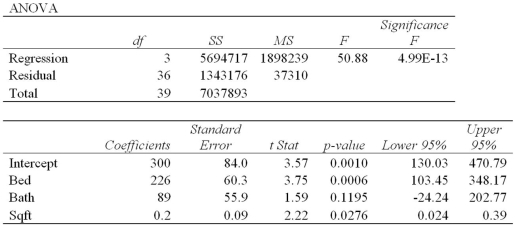 Refer to Exhibit 14-8.What would be the rent for a 1,000-square-foot apartment that has 2 bedrooms and 2 bathrooms?
(Multiple Choice)
4.8/5 (34)
Exhibit 14-6.A manager at a local bank analyzed the relationship between monthly salary (y,in $)and length of service (x,measured in months)for 30 employees.She estimates 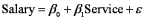 .The following table summarizes a portion of the regression results:
 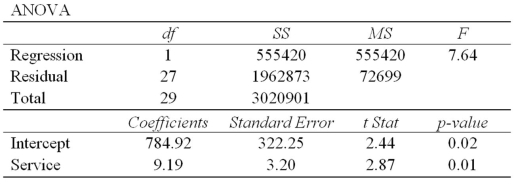 Refer to Exhibit 14-6.The coefficient of determination indicates that
(Multiple Choice)
4.9/5 (30)
Which of the following is not true of the standard error of the estimate?
(Multiple Choice)
4.9/5 (37)
Simple linear regression analysis differs from multiple regression analysis in that:
(Multiple Choice)
4.7/5 (30)
Exhibit 14-9.When estimating 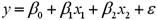 ,the following regression results were obtained.
 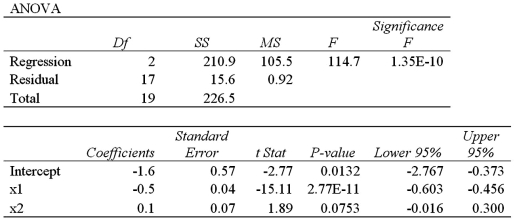 Refer to Exhibit 14-9.What is the standard error of the estimate?
(Multiple Choice)
4.8/5 (38)
Data was collected for 30 professional tennis players regarding their performance in Grand Slams (the four major tennis tournaments in the world).The response variable Win,expressed as a proportion ranging from 0 to 1,is believed to depend on two explanatory variables: the percentage of the double faults and the number of aces.The following model is estimated:  .A portion of the regression results is shown in the accompanying table.
 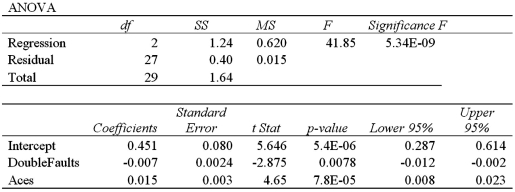 A)Predict the winning percentage for a player who had 20 double faults and 5 aces.
B)Interpret the slope coefficient attached to DoubleFaults.
C)Calculate the standard error of the estimate.If the sample mean for Win is 0.50,what can you infer about the model's predictive power.
D)Calculate and interpret the coefficient of determination.
E)Calculate the adjusted
A)Predict the winning percentage for a player who had 20 double faults and 5 aces.
B)Interpret the slope coefficient attached to DoubleFaults.
C)Calculate the standard error of the estimate.If the sample mean for Win is 0.50,what can you infer about the model's predictive power.
D)Calculate and interpret the coefficient of determination.
E)Calculate the adjusted
(Essay)
4.9/5 (29)
Consider the following data: 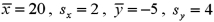 ,and
,and  .What is the sample regression equation?
(Multiple Choice)
4.8/5 (39)
Exhibit 14-5.An marketing analyst wants to examine the relationship between sales (in $1,000s)and advertising (in $100s)for firms in the food and beverage industry and collects monthly data for 25 firms.He estimates the model  .The following table below shows a portion of the regression results.
 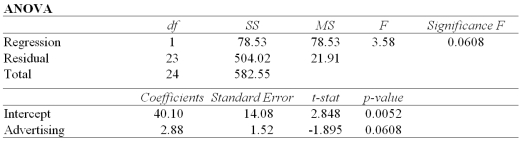 Refer to Exhibit 14-5.Interpret the slope coefficient.
(Multiple Choice)
4.9/5 (27)
John is an undergraduate business major studying at a local university.He wonders how his grade point average (GPA)can affect his future earnings.He asks five recent business school graduates information on their GPA and income (in $1000s).The following table shows this information.  a.Construct a scatterplot and verify that estimating a simple linear regression is appropriate in this case.
B)Calculate b0 and b1.What is the sample regression equation?
C)Interpret the coefficient for GPA.
D)Find the predicted income earned if a GPA equals 3.0,3.3 and 3.6.
a.Construct a scatterplot and verify that estimating a simple linear regression is appropriate in this case.
B)Calculate b0 and b1.What is the sample regression equation?
C)Interpret the coefficient for GPA.
D)Find the predicted income earned if a GPA equals 3.0,3.3 and 3.6.
(Essay)
4.9/5 (37)
The capital asset pricing model is given by: 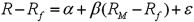 ,where
  = expected return on the market,
  = risk-free market return,and
  = expected return on a stock or portfolio of interest.The explanatory variable in this model is:
(Multiple Choice)
4.9/5 (31)
Compared to the sample correlation coefficient,the sample covariance is a better measure to gauge the strength of the linear relationship between two variables.
(True/False)
4.8/5 (38)
Unlike the coefficient of determination,the coefficient of correlation in a simple linear regression
(Multiple Choice)
4.8/5 (42)
Exhibit 14-10.A sociologist examines the relationship between the poverty rate and several socioeconomic factors.For the 50 states and the District of Columbia (n = 51),he collects data on the poverty rate (y,in %),the percent of the population with at least a high school education (x1),median income (x2,in $1000s),and the mortality rate per 1,000 residents (x3).He estimates the following model:  .The following table shows a portion of the regression results.
 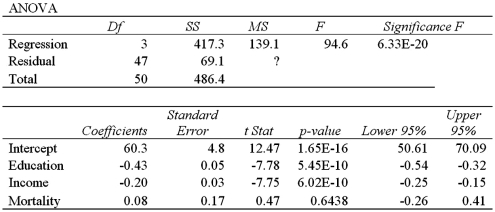 Notes: Data obtained from the Statistical Abstract of the US for the year 2007. Refer to Exhibit 14-10.What is the mean square error,MSE?
(Multiple Choice)
4.9/5 (37)
Given the augmented Phillips model: 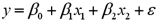 ,where y = actual rate of inflation (%),x1 = unemployment rate (%),and x2 = anticipated inflation rate (%).The response variable(s)in this model is(are)the:
(Multiple Choice)
4.7/5 (32)
Consider the following data:  ,and
,and  .Calculate the sample correlation coefficient,
  .
.
(Multiple Choice)
4.8/5 (38)
Consider the sample regression equation:  ,with an R2 value of 0.65.What is the value of the correlation coefficient between x and y?
(Multiple Choice)
4.8/5 (38)
The capital asset pricing model is given by:  ,where
  = expected return on the market,
  = risk-free market return,and
  = expected return on a stock or portfolio of interest.The response variable in this model is:
(Multiple Choice)
4.8/5 (41)
Consider the sample regression equation:  ,with an R2 value of 0.81.What is the value of the correlation coefficient between x and y?
(Multiple Choice)
4.8/5 (31)
Filters
- Essay(0)
- Multiple Choice(0)
- Short Answer(0)
- True False(0)
- Matching(0)