Exam 14: Regression Analysis
Exam 1: Statistics and Data68 Questions
Exam 2: Tabular and Graphical Methods99 Questions
Exam 3: Numerical Descriptive Measures123 Questions
Exam 4: Basic Probability Concepts107 Questions
Exam 5: Discrete Probability Distributions118 Questions
Exam 6: Continuous Probability Distributions114 Questions
Exam 7: Sampling and Sampling Distributions110 Questions
Exam 8: Interval Estimation111 Questions
Exam 9: Hypothesis Testing111 Questions
Exam 10: Statistical Inference Concerning Two Populations104 Questions
Exam 11: Statistical Inference Concerning Variance96 Questions
Exam 12: Chi-Square Tests100 Questions
Exam 13: Analysis of Variance89 Questions
Exam 14: Regression Analysis116 Questions
Exam 15: Inference With Regression Models117 Questions
Exam 16: Regression Models for Nonlinear Relationships95 Questions
Exam 17: Regression Models With Dummy Variables117 Questions
Exam 18: Time Series and Forecasting103 Questions
Exam 19: Returns, Index Numbers and Inflation98 Questions
Exam 20: Nonparametric Tests99 Questions
Select questions type
Exhibit 14-8.An real estate analyst believes that the three main factors that influence an apartment's rent in a college town are the number of bedrooms,the number of bathrooms,and the apartment's square footage.For 40 apartments,she collects data on the rent (y,in $),the number of bedrooms (x1),the number of bathrooms (x2),and its square footage (x3).She estimates the following model:  .The following table shows a portion of the regression results.
 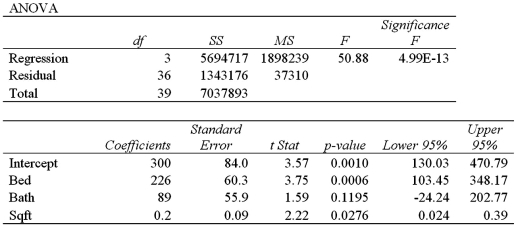 Refer to Exhibit 14-8.The coefficient of determination indicates that
(Multiple Choice)
4.9/5  (35)
(35)
Consider the following sample data: 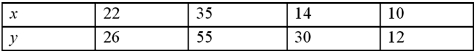 a.Construct a scatterplot.
B)Calculate b1 and b0.What is the sample regression equation?
C)Find the predicted value for y if x equals 10,15 and 20.
a.Construct a scatterplot.
B)Calculate b1 and b0.What is the sample regression equation?
C)Find the predicted value for y if x equals 10,15 and 20.
(Essay)
4.9/5 (35)
In the estimation of a multiple regression model with two explanatory variables and 20 observations,  and
and  .The value of adjusted R2 is closest to:
(Multiple Choice)
4.9/5 (31)
Consider the following simple linear regression model: 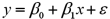 .The explanatory variable is:
(Multiple Choice)
4.8/5 (38)
A sample of 30 observations provides the following statistics:  a.Calculate and interpret the sample correlation coefficient
  .
B)Specify the hypotheses to determine whether or not x and y are significantly correlated.
C)At the 5% significance level,what is the conclusion to the test using the critical-value approach? Explain.
D)At the 5% significance level,what is the conclusion to the test using the p-value approach? Explain.
.
B)Specify the hypotheses to determine whether or not x and y are significantly correlated.
C)At the 5% significance level,what is the conclusion to the test using the critical-value approach? Explain.
D)At the 5% significance level,what is the conclusion to the test using the p-value approach? Explain.
(Essay)
4.7/5 (33)
Exhibit 14-4.Consider the following sample regression equation  ,where y is the supply for Product A (in 1000s)and x is the price of Product A (in $). Refer to Exhibit 14-4.The slope coefficient indicates that if
(Multiple Choice)
4.7/5 (30)
Exhibit 14-2.A statistics student is asked to estimate 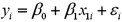 .She calculates the following values.
 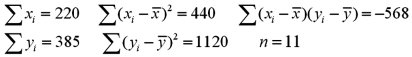 Refer to Exhibit 14-2.What is the sample regression equation?
(Multiple Choice)
4.7/5 (40)
Exhibit 14-1.Over the past 30 years,the sample standard deviations of the rates of return for stock X and Stock Y were 0.20 and 0.12,respectively.The sample covariance between the returns of X and Y is 0.0096. Refer to Exhibit 14-1.In order to determine whether the correlation coefficient is significantly different from zero,the appropriate hypotheses are:
(Multiple Choice)
4.8/5 (37)
In a simple linear regression model,if the plots on a scatter diagram lie on a straight line,what is the standard error of the estimate?
(Multiple Choice)
4.8/5 (31)
The following scatterplot implies that the relationship between the two variables x and y is: 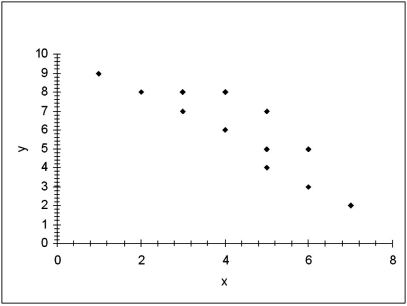
(Multiple Choice)
4.8/5 (39)
Exhibit 14-10.A sociologist examines the relationship between the poverty rate and several socioeconomic factors.For the 50 states and the District of Columbia (n = 51),he collects data on the poverty rate (y,in %),the percent of the population with at least a high school education (x1),median income (x2,in $1000s),and the mortality rate per 1,000 residents (x3).He estimates the following model:  .The following table shows a portion of the regression results.
 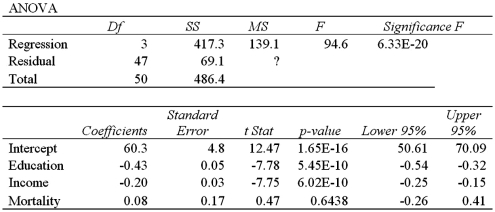 Notes: Data obtained from the Statistical Abstract of the US for the year 2007. Refer to Exhibit 14-10.The coefficient of determination indicates that
(Multiple Choice)
4.7/5 (30)
In the estimation of a multiple regression model with two explanatory variables and 20 observations,  and
and  .What is the value of R2?
(Multiple Choice)
4.9/5 (30)
Which of the following statements is least accurate concerning correlation analysis?
(Multiple Choice)
5.0/5 (27)
When two regression models applied on the same data set have the same response variable but a different number of explanatory variables,the model that would evidently provide the better fit is the one with a
(Multiple Choice)
4.8/5 (32)
Exhibit 14-1.Over the past 30 years,the sample standard deviations of the rates of return for stock X and Stock Y were 0.20 and 0.12,respectively.The sample covariance between the returns of X and Y is 0.0096. Refer to Exhibit 14-1.When testing whether the correlation coefficient differs from zero,the value of the test statistic is  .At the 5% significance level,the critical value is
  .The conclusion to the hypothesis test is to:
(Multiple Choice)
4.8/5 (32)
Filters
- Essay(0)
- Multiple Choice(0)
- Short Answer(0)
- True False(0)
- Matching(0)