Exam 14: Regression Analysis
Exam 1: Statistics and Data68 Questions
Exam 2: Tabular and Graphical Methods99 Questions
Exam 3: Numerical Descriptive Measures123 Questions
Exam 4: Basic Probability Concepts107 Questions
Exam 5: Discrete Probability Distributions118 Questions
Exam 6: Continuous Probability Distributions114 Questions
Exam 7: Sampling and Sampling Distributions110 Questions
Exam 8: Interval Estimation111 Questions
Exam 9: Hypothesis Testing111 Questions
Exam 10: Statistical Inference Concerning Two Populations104 Questions
Exam 11: Statistical Inference Concerning Variance96 Questions
Exam 12: Chi-Square Tests100 Questions
Exam 13: Analysis of Variance89 Questions
Exam 14: Regression Analysis116 Questions
Exam 15: Inference With Regression Models117 Questions
Exam 16: Regression Models for Nonlinear Relationships95 Questions
Exam 17: Regression Models With Dummy Variables117 Questions
Exam 18: Time Series and Forecasting103 Questions
Exam 19: Returns, Index Numbers and Inflation98 Questions
Exam 20: Nonparametric Tests99 Questions
Select questions type
Consider the following data: 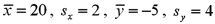 ,and
,and  .What is the sample regression equation?
(Multiple Choice)
4.9/5  (36)
(36)
What is the name of the variable that's used to predict another variable?
(Multiple Choice)
4.8/5 (36)
A scatterplot can help determine if two variables are related in some systematic way.
(True/False)
4.7/5 (27)
Which of the following identifies the range for a correlation coefficient?
(Multiple Choice)
5.0/5 (38)
Exhibit 14-1.Over the past 30 years,the sample standard deviations of the rates of return for stock X and Stock Y were 0.20 and 0.12,respectively.The sample covariance between the returns of X and Y is 0.0096. Refer to Exhibit 14-1.The correlation of the rates of return between X and Y is closest to:
(Multiple Choice)
4.8/5 (37)
Consider the following sample data:  a.Construct and interpret a scatterplot.
B)Calculate and interpret the sample covariance.
C)Calculate and interpret the sample correlation coefficient.
a.Construct and interpret a scatterplot.
B)Calculate and interpret the sample covariance.
C)Calculate and interpret the sample correlation coefficient.
(Essay)
4.8/5 (36)
Exhibit 14-5.An marketing analyst wants to examine the relationship between sales (in $1,000s)and advertising (in $100s)for firms in the food and beverage industry and collects monthly data for 25 firms.He estimates the model  .The following table below shows a portion of the regression results.
 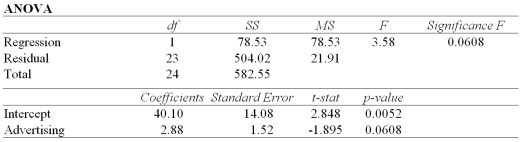 Refer to Exhibit 14-5.Predict Sales for a firm with Advertising of $500.
(Multiple Choice)
4.9/5 (40)
The positive square root of the coefficient of determination in simple linear regression is always equal to the correlation coefficient.
(True/False)
4.9/5 (35)
When testing whether the correlation coefficient differs from zero,the value of the test statistic is  with a corresponding p-value of 0.0061.At the 5% significance level,can you conclude that the correlation coefficient differs from zero?
(Multiple Choice)
4.8/5 (37)
Exhibit 14-5.An marketing analyst wants to examine the relationship between sales (in $1,000s)and advertising (in $100s)for firms in the food and beverage industry and collects monthly data for 25 firms.He estimates the model  .The following table below shows a portion of the regression results.
  Refer to Exhibit 14-5.Calculate the standard error of the estimate.
(Multiple Choice)
4.8/5 (28)
The value 0.75 of a sample correlation coefficient indicates a stronger linear relationship than that of 0.60.
(True/False)
4.7/5 (29)
A simple linear regression of the return of firm A (  )on the return of firm B (
  ),based on 18 observations,is
  = 2.2 + 0.4
  .If the coefficient of determination from this regression is 0.09 calculate the correlation between
  and
and  .
.
(Multiple Choice)
4.9/5 (41)
The correlation coefficient could be considered as a "standardized covariance."
(True/False)
4.9/5 (33)
Exhibit 14-3.Consider the following sample regression equation  ,where y is the demand for Product A (in 1000s)and x is the price of the product (in $). Refer to Exhibit 14-3.The slope coefficient indicates that if
(Multiple Choice)
4.8/5 (36)
A regression equation was estimated as 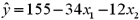 .If
.If  and
and  ,the predicted value of y would be:
(Multiple Choice)
5.0/5 (39)
In testing the population correlation coefficient,the alternative hypothesis is  .
.
(True/False)
4.9/5 (35)
Another name for an explanatory variable is the dependent variable.
(True/False)
4.9/5 (29)
When testing whether the correlation coefficient differs from zero,the value of the test statistic is  with a corresponding p-value of 0.0653.At the 5% significance level,can you conclude that the correlation coefficient differs from zero?
(Multiple Choice)
4.9/5 (32)
Filters
- Essay(0)
- Multiple Choice(0)
- Short Answer(0)
- True False(0)
- Matching(0)