Exam 3: Numerical Descriptive Measures
Exam 1: Statistics and Data68 Questions
Exam 2: Tabular and Graphical Methods99 Questions
Exam 3: Numerical Descriptive Measures123 Questions
Exam 4: Basic Probability Concepts107 Questions
Exam 5: Discrete Probability Distributions118 Questions
Exam 6: Continuous Probability Distributions114 Questions
Exam 7: Sampling and Sampling Distributions110 Questions
Exam 8: Interval Estimation111 Questions
Exam 9: Hypothesis Testing111 Questions
Exam 10: Statistical Inference Concerning Two Populations104 Questions
Exam 11: Statistical Inference Concerning Variance96 Questions
Exam 12: Chi-Square Tests100 Questions
Exam 13: Analysis of Variance89 Questions
Exam 14: Regression Analysis116 Questions
Exam 15: Inference With Regression Models117 Questions
Exam 16: Regression Models for Nonlinear Relationships95 Questions
Exam 17: Regression Models With Dummy Variables117 Questions
Exam 18: Time Series and Forecasting103 Questions
Exam 19: Returns, Index Numbers and Inflation98 Questions
Exam 20: Nonparametric Tests99 Questions
Select questions type
In a marketing class of 60 students,the mean and the standard deviation of scores was 70 and 5,respectively.Use Chebyshev's Theorem to determine the number of students who scored less than 60 or more than 80:
(Multiple Choice)
4.9/5  (44)
(44)
Calculate the interquartile range from the following data: 1,2,4,5,10,12,18.
(Multiple Choice)
4.8/5 (41)
When applicable,the empirical rule provides the approximate percentage of observations that fall within how many standard deviations from the mean?
(Multiple Choice)
4.8/5 (39)
The Boom company has recently decided to raise the salaries of all employees by 10 percent.Which of the following is (are)expected to be affected by this raise?
(Multiple Choice)
4.8/5 (43)
Consider a population with data values of  . The population standard deviation is closest to:
(Multiple Choice)
5.0/5 (37)
A college professor collected data on the number of hours spent by his 100 students over the weekend to prepare for Monday's Business Statistics exam.He processed the data by Excel and the following incomplete output is available. 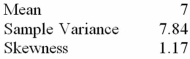 The coefficient of variation in the data is
(Multiple Choice)
4.8/5 (37)
The advantage of using mean absolute deviation rather than variance as a measure of dispersion is that mean absolute deviation:
(Multiple Choice)
4.8/5 (28)
Professors at a local university earn an average salary of $80,000 with a standard deviation of $6,000.The salary distribution cannot be regarded as bell-shaped.What can be said about the percentage of salaries that are less than $68,000 or more than or more than $92,000?
(Multiple Choice)
4.9/5 (33)
What is the difference between Chebyshev's theorem and the empirical rule?
(Multiple Choice)
4.7/5 (32)
Amounts spent by a sample of 200 customers at a retail store are summarized in the following relative frequency distribution. 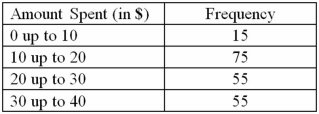 The mean amount spent by customers is closest to:
(Multiple Choice)
4.8/5 (39)
A surfer visited his favorite beach 50 times and recorded the wave height each time in the following table. 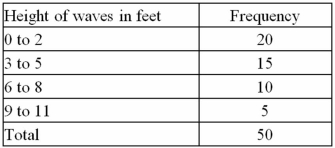 a.Calculate the average wave height.
B)Calculate the variance and standard deviation wave height for this sample.
a.Calculate the average wave height.
B)Calculate the variance and standard deviation wave height for this sample.
(Essay)
4.9/5 (31)
The mean grade of the 30 students in Section 1 is 80.The mean grade of the 40 students in Section 2 is 85.The mean grade of the 30 students in Section 3 is 80.What is the mean grade of all students from the three sections combined?
(Multiple Choice)
4.9/5 (39)
Amounts spent by a sample of 50 customers at a retail store are summarized in the following relative frequency distribution. 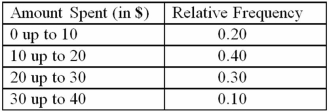 The mean amount spent by customers is closest to:
(Multiple Choice)
4.9/5 (28)
The covariance between the returns on two assets is negative.This occurs when:
(Multiple Choice)
4.8/5 (41)
When interpreting the covariance between variables x and y,which of the following statements is most accurate?
(Multiple Choice)
4.8/5 (39)
Yearly returns (rounded to the nearest percent)for GLD a gold exchange traded fund and SLV a silver exchange traded fund are reported in the following table. 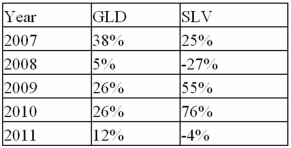 a.Calculate the covariance between GLD and SLV.
B)Calculate and interpret the correlation coefficient.
a.Calculate the covariance between GLD and SLV.
B)Calculate and interpret the correlation coefficient.
(Essay)
4.8/5 (40)
Filters
- Essay(0)
- Multiple Choice(0)
- Short Answer(0)
- True False(0)
- Matching(0)