Exam 3: Numerical Descriptive Measures
Exam 1: Statistics and Data68 Questions
Exam 2: Tabular and Graphical Methods99 Questions
Exam 3: Numerical Descriptive Measures123 Questions
Exam 4: Basic Probability Concepts107 Questions
Exam 5: Discrete Probability Distributions118 Questions
Exam 6: Continuous Probability Distributions114 Questions
Exam 7: Sampling and Sampling Distributions110 Questions
Exam 8: Interval Estimation111 Questions
Exam 9: Hypothesis Testing111 Questions
Exam 10: Statistical Inference Concerning Two Populations104 Questions
Exam 11: Statistical Inference Concerning Variance96 Questions
Exam 12: Chi-Square Tests100 Questions
Exam 13: Analysis of Variance89 Questions
Exam 14: Regression Analysis116 Questions
Exam 15: Inference With Regression Models117 Questions
Exam 16: Regression Models for Nonlinear Relationships95 Questions
Exam 17: Regression Models With Dummy Variables117 Questions
Exam 18: Time Series and Forecasting103 Questions
Exam 19: Returns, Index Numbers and Inflation98 Questions
Exam 20: Nonparametric Tests99 Questions
Select questions type
Which of the following is true when using the empirical rule for a set of sample data?
(Multiple Choice)
4.8/5  (45)
(45)
Which of the following statements is most accurate when defining percentiles?
(Multiple Choice)
4.8/5 (42)
The standard deviation is the positive square root of the variance.
(True/False)
4.8/5 (25)
Which of the following relationships may be concluded from examining the correlation coefficient?
(Multiple Choice)
4.8/5 (32)
The following are daily returns for the Dow Jones Industrial average during the week of October 13th 2008.The returns are rounded to the nearest whole number.
11%,-1.00%,-8.00%,5.00%,-1.00%
A)Calculate the arithmetic mean return.
B)Calculate the geometric mean return.
(Short Answer)
4.7/5 (34)
The following data represents the number of unique visitors and the revenue a website generated for the months of July through December. 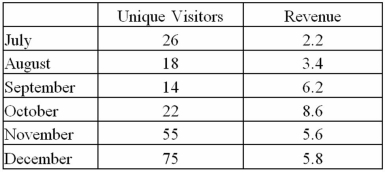 a.What is the sample standard deviation for the number of unique visitors and the revenue?
B)Calculate the coefficient of variations.Which variable has a higher relative dispersion?
C)Calculate the sample correlation coefficient between the number of unique visitors and Revenue.
D)Comment on the strength of the linear relationship.What does this mean for the owner of the website?
a.What is the sample standard deviation for the number of unique visitors and the revenue?
B)Calculate the coefficient of variations.Which variable has a higher relative dispersion?
C)Calculate the sample correlation coefficient between the number of unique visitors and Revenue.
D)Comment on the strength of the linear relationship.What does this mean for the owner of the website?
(Essay)
4.8/5 (35)
Professors at a local university earn an average salary of $80,000 with a standard deviation of $6,000.The salary distribution is approximately bell-shaped.What can be said about the percentage of salaries that are at least $74,000?
(Multiple Choice)
4.9/5 (41)
A college professor collected data on the number of hours spent by his 100 students over the weekend to prepare for Monday's Business Statistics exam.He processed the data by Excel and the following incomplete output is available. 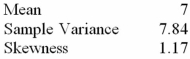 The median is most likely to be
(Multiple Choice)
4.8/5 (27)
Amounts spent by a sample of 200 customers at a retail store are summarized in the following relative frequency distribution. 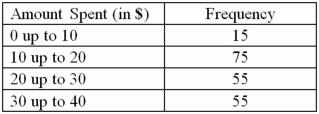 The median amount will fall in the following class interval:
(Multiple Choice)
4.8/5 (39)
Which of the following statements about variance is most accurate? Variance:
(Multiple Choice)
4.8/5 (33)
The sample data below shows the number of hours spent by 5 students over the weekend to prepare for Monday's Business Statistics exam.  The interquartile range of the data is closest to:
(Multiple Choice)
4.8/5 (39)
The variance and standard deviation are the most widely used measures of central location.
(True/False)
5.0/5 (41)
The terms central location or central tendency refer to the way quantitative data tend to cluster around some middle or central value.
(True/False)
4.9/5 (31)
The sample data below shows the number of hours spent by 5 students over the weekend to prepare for Monday's Business Statistics exam.  The mean and the median of the numbers of hours spent by the 5 students are
(Multiple Choice)
4.9/5 (32)
The table below gives the deviations of a portfolio's annual total returns from its benchmark's annual returns,for a 6-year period ending in 2011. 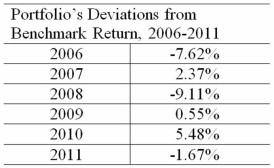 The arithmetic mean return and median return are closest to:
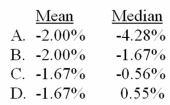
(Multiple Choice)
4.8/5 (44)
A portfolio manager generates a 5% return in 2008,a 12% return in 2009,a negative 6% return in 2010,and a return of 2% (non-annualized)in the first quarter of 2011.The annualized return for the entire period is closest to:
(Multiple Choice)
4.9/5 (36)
Filters
- Essay(0)
- Multiple Choice(0)
- Short Answer(0)
- True False(0)
- Matching(0)