Exam 3: Numerical Descriptive Measures
Exam 1: Statistics and Data68 Questions
Exam 2: Tabular and Graphical Methods99 Questions
Exam 3: Numerical Descriptive Measures123 Questions
Exam 4: Basic Probability Concepts107 Questions
Exam 5: Discrete Probability Distributions118 Questions
Exam 6: Continuous Probability Distributions114 Questions
Exam 7: Sampling and Sampling Distributions110 Questions
Exam 8: Interval Estimation111 Questions
Exam 9: Hypothesis Testing111 Questions
Exam 10: Statistical Inference Concerning Two Populations104 Questions
Exam 11: Statistical Inference Concerning Variance96 Questions
Exam 12: Chi-Square Tests100 Questions
Exam 13: Analysis of Variance89 Questions
Exam 14: Regression Analysis116 Questions
Exam 15: Inference With Regression Models117 Questions
Exam 16: Regression Models for Nonlinear Relationships95 Questions
Exam 17: Regression Models With Dummy Variables117 Questions
Exam 18: Time Series and Forecasting103 Questions
Exam 19: Returns, Index Numbers and Inflation98 Questions
Exam 20: Nonparametric Tests99 Questions
Select questions type
The annual returns (in percent)for a sample of stocks in the technology industry over the past year are as follows:  The sample standard deviation is closest to:
(Multiple Choice)
4.7/5  (36)
(36)
A large city in Southern California collected data on education and the unemployment rate for its residents with a survey.The following is the survey data. 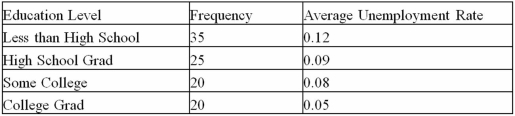 a.Calculate the mean unemployment rate for the city.
B)Calculate the sample standard deviation unemployment rate in the city.
a.Calculate the mean unemployment rate for the city.
B)Calculate the sample standard deviation unemployment rate in the city.
(Essay)
4.8/5 (27)
The following is summary measures for Google and Apple for 2005-2010. 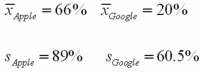 a.Which fund had the higher arithmetic average return?
B)Which fund was riskier over this time period?
C)Given a risk-free rate of 1%,which fund has the higher Sharpe ratio? What does this imply?
a.Which fund had the higher arithmetic average return?
B)Which fund was riskier over this time period?
C)Given a risk-free rate of 1%,which fund has the higher Sharpe ratio? What does this imply?
(Essay)
4.7/5 (41)
The annual returns (in percent)for a sample of stocks in the technology industry over the past year are as follows:  The average return is closest to:
(Multiple Choice)
4.8/5 (34)
Professors at a local university earn an average salary of $80,000 with a standard deviation of $6,000.With the beginning of the next academic year,all professors will get a 2% raise.What will be the average and the standard deviation of their new salaries?
(Multiple Choice)
4.9/5 (38)
The following is return data for a Retail sector ETF and Energy Sector ETF for the years 2007 through 2011. 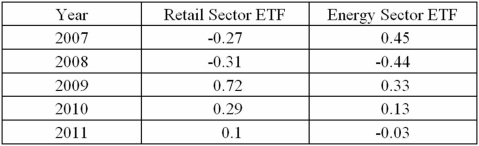 a.What is the arithmetic mean return for each ETF?
B)What is the geometric mean return for each ETF?
C)What is the sample standard deviation for each ETF? Which ETF was riskier over this time period?
D)Given a risk free rate of 5%.What is the Sharpe Ratio for each ETF? Which investment had a better return per unit of risk over this time period?
a.What is the arithmetic mean return for each ETF?
B)What is the geometric mean return for each ETF?
C)What is the sample standard deviation for each ETF? Which ETF was riskier over this time period?
D)Given a risk free rate of 5%.What is the Sharpe Ratio for each ETF? Which investment had a better return per unit of risk over this time period?
(Essay)
4.8/5 (45)
The following is a list of average wind speeds at a local surf spot in California over the last week.
8,17,19,6,3,9,12
A)What is the range in wind speed?
B)What is the Mean Absolute Deviation of the wind speed?
(Essay)
4.8/5 (39)
A luxury apartment complex in South Beach Miami is for sale.The owner has received the following offers in millions of dollars.
64,72,66,58,78,82
A)What is the mean offer price? What is the median offer price? Is the mean a good measure of central location?
B)What is the sample standard deviation of the offers?
C)What is equivalent to a 75th percentile offer?
(Essay)
4.8/5 (35)
A box plot is useful when comparing similar information gathered at different places or times.
(True/False)
4.9/5 (33)
The data shows Operating Expenses (In Millions)for British Petroleum for the years 2008 through 2010. 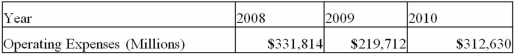 a.Use the growth rates from 2008-2009 and 2009-2010 to calculate the average growth rate.
B)Calculate the average growth rate directly from sales.
a.Use the growth rates from 2008-2009 and 2009-2010 to calculate the average growth rate.
B)Calculate the average growth rate directly from sales.
(Short Answer)
4.9/5 (38)
Amounts spent by a sample of 50 customers at a retail store are summarized in the following relative frequency distribution. 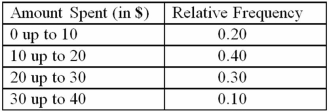 The median amount will fall in the following class interval:
(Multiple Choice)
4.9/5 (33)
John lives in Los Angeles and hates the traffic.He asked a sample of 6 of his coworkers who live all over Los Angles how many hours they spend commuting every year.These are their responses in hours per year.
20,240,260,300,310,570
A)Calculate and interpret the 30th,50th,and 70th percentiles.
B)Are there any outliers? Is the distribution symmetric? If not,comment on its skewness.
(Essay)
4.9/5 (45)
The following represent the sizes of fleece jackets for kids sold at a local Old Navy Store:
6,7,4,8,10,4,5,4,4,6.
Calculate the mean,median,and mode size of fleece jackets for kids.Which of these measures of the central location represents the age that the store would like to target for advertisement dollars.
(Short Answer)
4.7/5 (52)
Mean-variance analysis suggests that investments with lower average returns are also associated with higher risks.
(True/False)
4.9/5 (39)
As of September 30,2011,the earnings per share,EPS,of five firms in the beverages industry are as follows:  The 25th percentile and the 75th percentile of the EPS are closest to:
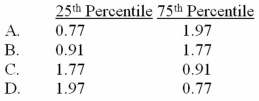
(Multiple Choice)
4.9/5 (35)
In its standard form,Chebyshev's theorem provides a lower bound on:
(Multiple Choice)
4.8/5 (35)
Total Revenue,in $millions,for Apple Computers was 42,905 in 2009,65,225 in 2010,and 108,249 in 2011.The average growth rate of revenue during these three years is closest to:
(Multiple Choice)
4.9/5 (38)
The price to earnings ratio,also called the P/E ratio of a stock is a measure of the price of a share relative to the annual net income per share earned by the firm.Suppose the P/Es for a firm's common stock during the past four quarters be 10,12,15,and 11,respectively.The standard deviation of the P/E ratio over the four quarters is:
(Multiple Choice)
4.8/5 (40)
The sample data below shows the number of hours spent by 5 students over the weekend to prepare for Monday's Business Statistics exam.  The sample standard deviation of the number of hours spent by the 5 students is closest to:
(Multiple Choice)
5.0/5 (43)
The following data represents motor vehicle theft rates per 100,000 people for the cities of Detroit,Michigan,Newark,New Jersey,St.Louis,Missouri,Oakland,California,Atlanta,Georgia,and Fresno,California.These six cities had the highest per-capita motor vehicle theft rates in the nation in 2010. 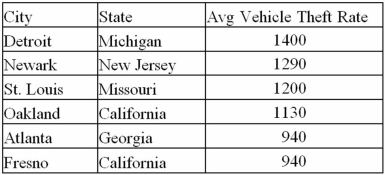 a.What is the mean and median per-capita theft rates of the above cities?
B)Given the standard deviation of the per-capita crime rate in Detroit is 200 thefts per 100,000 use the empirical rule to calculate the probability Detroit has over 1800 thefts per 100,000 next year?
a.What is the mean and median per-capita theft rates of the above cities?
B)Given the standard deviation of the per-capita crime rate in Detroit is 200 thefts per 100,000 use the empirical rule to calculate the probability Detroit has over 1800 thefts per 100,000 next year?
(Essay)
4.9/5 (32)
Filters
- Essay(0)
- Multiple Choice(0)
- Short Answer(0)
- True False(0)
- Matching(0)