Exam 3: Numerical Descriptive Measures
Exam 1: Statistics and Data68 Questions
Exam 2: Tabular and Graphical Methods99 Questions
Exam 3: Numerical Descriptive Measures123 Questions
Exam 4: Basic Probability Concepts107 Questions
Exam 5: Discrete Probability Distributions118 Questions
Exam 6: Continuous Probability Distributions114 Questions
Exam 7: Sampling and Sampling Distributions110 Questions
Exam 8: Interval Estimation111 Questions
Exam 9: Hypothesis Testing111 Questions
Exam 10: Statistical Inference Concerning Two Populations104 Questions
Exam 11: Statistical Inference Concerning Variance96 Questions
Exam 12: Chi-Square Tests100 Questions
Exam 13: Analysis of Variance89 Questions
Exam 14: Regression Analysis116 Questions
Exam 15: Inference With Regression Models117 Questions
Exam 16: Regression Models for Nonlinear Relationships95 Questions
Exam 17: Regression Models With Dummy Variables117 Questions
Exam 18: Time Series and Forecasting103 Questions
Exam 19: Returns, Index Numbers and Inflation98 Questions
Exam 20: Nonparametric Tests99 Questions
Select questions type
The sample data below shows the number of hours spent by 5 students over the weekend to prepare for Monday's Business Statistics exam.  The 75th percentile of the data is closest to:
(Multiple Choice)
4.9/5  (31)
(31)
The coefficient of variation is a unit free measure of dispersion.
(True/False)
4.8/5 (45)
As of September 30,2011,the earnings per share,EPS,of five firms in the biotechnology industry are as follows:  The sample mean and the sample standard deviation are closest to:
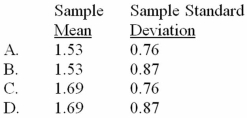
(Multiple Choice)
4.7/5 (38)
The following table shows the annual returns (in percent)Chevron and Caterpillar for 2007-2010. 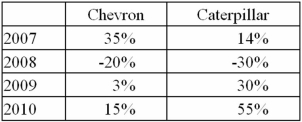 a.Which fund had the higher arithmetic average return?
B)Which fund was riskier over this time period?
C)Given a risk-free rate of 1%,which fund has the higher Sharpe ratio? What does this imply?
a.Which fund had the higher arithmetic average return?
B)Which fund was riskier over this time period?
C)Given a risk-free rate of 1%,which fund has the higher Sharpe ratio? What does this imply?
(Essay)
4.8/5 (39)
The following frequency distribution represents the number of hours studied per week by a sample of 50 students. 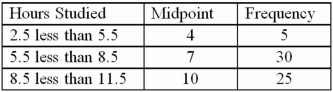 The standard deviation of the number of hours studied is:
(Multiple Choice)
4.7/5 (41)
The following data is a list of the magnitudes of six of Alaska's largest recorded earthquakes.
9.2,7.9,8.7,8.6,7.9,8.1
Calculate the mean,median and mode of the magnitude of Alaska's Earthquakes.
(Short Answer)
4.7/5 (31)
A portfolio's annual total returns (in percent)for a 5-year period are:  The median and the standard deviation for this sample are closest to:
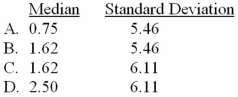
(Multiple Choice)
4.9/5 (37)
The following frequency distribution represents the number of hours studied per week by a sample of 50 students. 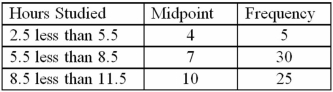 The mean number of hours studied is:
(Multiple Choice)
4.8/5 (39)
The following is data a veterinarian collected from some of her clients.It is a rough estimate of a dog's weight and how long the dog lived. 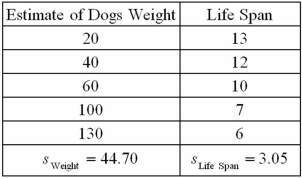 a.Calculate the covariance between a dog's weight and its life span.
B)Calculate and interpret the correlation coefficient.
a.Calculate the covariance between a dog's weight and its life span.
B)Calculate and interpret the correlation coefficient.
(Essay)
5.0/5 (43)
For k > 1,Chebyshev's theorem is useful in estimating the proportion of observations that fall within:
(Multiple Choice)
4.8/5 (32)
The MAD is a less effective measure of variation when compared with the average deviation from the mean.
(True/False)
4.9/5 (32)
Consider a population with data values of  . The population variance is closest to:
(Multiple Choice)
4.7/5 (40)
In an accounting class of 200 students,the mean and standard deviation of scores was 70 and 5,respectively.Use the empirical rule to determine the number of students who scored less than 65 or more than 75.
(Multiple Choice)
4.8/5 (36)
An investor bought common stock of Blackstone Company on several occasions at the following prices. 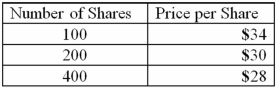 The average price per share at which the investor bought these shares of common stock was closest to:
(Multiple Choice)
4.8/5 (32)
The following data represent monthly returns (in percent):  The geometric mean return is closest to:
(Multiple Choice)
4.9/5 (32)
Filters
- Essay(0)
- Multiple Choice(0)
- Short Answer(0)
- True False(0)
- Matching(0)