Exam 1: Functions and Models
Exam 1: Functions and Models118 Questions
Exam 2: Limits and Derivatives127 Questions
Exam 3: Differentiation Rules248 Questions
Exam 4: Applications of Differentiation273 Questions
Exam 5: Integrals239 Questions
Exam 6: Applications of Integration189 Questions
Exam 7: Differential Equations154 Questions
Exam 8: Infinite Sequences and Series341 Questions
Exam 9: Vectors and the Geometry of Space269 Questions
Exam 10: Vector Functions111 Questions
Exam 11: Partial Derivatives294 Questions
Exam 12: Multiple Integrals270 Questions
Exam 13: Vector Calculus240 Questions
Select questions type
Suppose pH = -log [H ]. Suppose further that for vinegar, the hydrogen ion concentration in moles per liter is given by [H ] . Find the pH of the vinegar.
Free
(Short Answer)
4.9/5  (32)
(32)
Correct Answer: Verified
pH = 3.28
For the exponential function f (x) = c . a + b whose graph is given below, determine the values of a, b, and c. 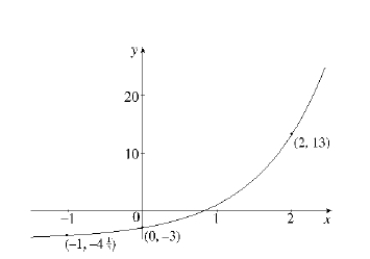
Free
(Short Answer)
4.7/5 (25)
Correct Answer:Verified
a = 3, b = -5, c = 2
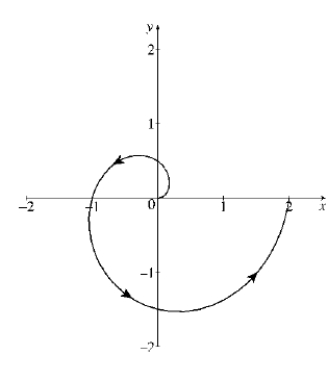
Sketch a possible parametric curve defined by the following table of values. t 0 \pi 2\pi x 0 0.18 0 -0.53 -1 -0.88 0 1.24 2 y 0 0.18 0.5 0.53 0 -0.88 -1.5 -1.24 0
Free
(Essay)
4.8/5 (38)
Correct Answer:Verified
Relative to the graph of y = x , the graph of y = x is changed in what way?
(Multiple Choice)
4.8/5 (37)
Relative to the graph of y = x , the graph of y = x - 2 is changed in what way?
(Multiple Choice)
4.9/5 (37)
Determine an appropriate viewing rectangle for the graph of the function f (x) = 6x + x - 10.
(Multiple Choice)
4.9/5 (29)
Relative to the graph of y = sin x, the graph of y = 3 sin x is changed in what way?
(Multiple Choice)
4.8/5 (38)
The following table contains United States population data for the years 1790-2000 at intervals of 10 years. Year Years since 1790 U.S. population (millions) 1790 0 3.9 1800 10 5.2 1810 20 7.2 1820 30 9.6 1830 40 12.9 1840 50 17.1 1850 60 23.2 1860 70 31.4 1870 80 39.8 1880 90 50.2 1890 100 62.9 Year Years since 1790 U.S. population (millions) 1900 110 76.0 1910 120 92.0 1920 130 105.7 1930 140 122.8 1940 150 131.7 1950 160 150.7 1960 170 178.5 1970 180 202.5 1980 190 225.5 1990 200 248.7 2000 210 281.4
(a) Make a scatter plot for the data and use your scatter plot to determine a mathematical model for the U.S. population.(b) Use your model to predict the U.S. population in 2005.
(Essay)
4.9/5 (29)
Determine an appropriate viewing rectangle for the graph of the function f (x) = 20 sin (40x) 10.
(Multiple Choice)
4.9/5 (38)
Determine an appropriate viewing rectangle for the graph of the function f (x) = 4x - .
(Multiple Choice)
4.7/5 (39)
A function has a domain [-4, 4] and a portion of its graph is shown. ![A function has a domain [-4, 4] and a portion of its graph is shown. (a) Complete the graph of f of its is known that f is an even function.(b) Complete the graph of f if it is known that f is an odd function.](https://storage.examlex.com/TB2033/11eaa8e2_11c9_94d4_96ab_edd4f2eaaa50_TB2033_00.jpg) (a) Complete the graph of f of its is known that f is an even function.(b) Complete the graph of f if it is known that f is an odd function.
(a) Complete the graph of f of its is known that f is an even function.(b) Complete the graph of f if it is known that f is an odd function.
(Essay)
4.8/5 (35)
Suppose that the position of one particle at time t is given by
x = 4 sin t, y = 2 cos t for 0 and the position of a second particle is given by
x = 2 cos t - 1, y = 4 sin t + 2 for 0 (a) How many points of intersection are there for these two paths?
(b) Are any of these collision points (that is, points where the particles are at the same place at the same time)? If so, find the collision points.
(Short Answer)
4.9/5 (40)
Suppose that P(t) represents the pressure (in pounds per square inch) in a tire with a slow air leak t minutes after the leak begins. In practical terms, what is:
(a) P(20)
(b) P (20)
(Essay)
4.8/5 (34)
Let f(x) = 2 - x and g(x) = 3 x. Find the value of when x = - 5.
(Multiple Choice)
4.8/5 (39)
Filters
- Essay(0)
- Multiple Choice(0)
- Short Answer(0)
- True False(0)
- Matching(0)