Exam 6: Antigen Presentation to T Lymphocytes
Exam 1: Basic Concepts in Immunology44 Questions
Exam 2: Innate Immunity: the First Lines of Defense32 Questions
Exam 3: The Induced Responses of Innate Immunity39 Questions
Exam 4: Antigen Recognition by B-Cell and T-Cell Receptors28 Questions
Exam 5: The Generation of Lymphocyte Antigen Receptors33 Questions
Exam 6: Antigen Presentation to T Lymphocytes30 Questions
Exam 7: Lymphocyte Receptor Signaling42 Questions
Exam 8: Development and Survival of Lymphocytes37 Questions
Exam 9: T-Cell-Mediated Immunity37 Questions
Exam 10: The Humoral Immune Response30 Questions
Exam 11: Integrated Dynamics of Innate and Adaptive Immunity28 Questions
Exam 12: The Mucosal Immune System27 Questions
Exam 13: Failures of Host Defense Mechanisms43 Questions
Exam 14: Allergy and Allergic Diseases26 Questions
Exam 15: Autoimmunity and Transplantation31 Questions
Exam 16: Manipulation of the Immune Response34 Questions
Select questions type
The adaptive immune system uses multiple strategies to generate diversity in our ability to mount responses to a wide array of infectious microorganisms. These strategies include the generation of diverse repertoires of B-cell and T-cell antigen receptors, as well as polymorphism of MHC genes. The polymorphism of MHC genes differs from the diversity of lymphocyte antigen receptors in that:
(Multiple Choice)
4.7/5  (38)
(38)
Several types of pathogens encode proteins that function as superantigens, which activate massive numbers of T cells in an individual. One example is the staphylococcal enterotoxins that cause food poisoning. These superantigens are the exception to the general rule that T cells only recognize specific peptide:MHC complexes, because they:
(Multiple Choice)
4.9/5 (47)
The extensive polymorphism of MHC genes in the population is thought to represent an evolutionary response to outflank the evasive strategies of pathogens. This polymorphism makes it difficult for pathogens to eliminate all potential MHC binding epitopes from their proteins. Based on this reasoning, it would seem advantageous for each individual to encode more than three different MHC class I and three different MHC class II genes per chromosome copy. If some individuals in the population had MHC loci that encoded 10 different MHC class I and 10 different MHC class II genes, the T cell repertoire in those individuals would likely be:
(Multiple Choice)
4.9/5 (33)
Alloreactivity refers to the ability of T cells to respond to allelic polymorphisms in MHC molecules when mixed with antigen-presenting cells from a genetically different individual. The T-cell receptors involved in alloreactive responses are recognizing amino acid sequences on foreign MHC molecules and do not interact at all with the peptides bound to these MHC molecules.
(True/False)
4.7/5 (37)
MHC polymorphism at individual MHC genes appears to have been strongly selected by evolutionary pressures. In other words, there appears to be selection for maintaining hundreds to thousands of different alleles of each MHC gene in the population. This notion is based on the observation that nucleotide differences between alleles that lead to amino acid substitutions are more frequent than those that are silent substitutions (i.e., not changing the amino acid sequence of the protein). In addition, the positions within the MHC protein where most of the allelic sequence variation occurs are not randomly distributed, but are concentrated in certain regions of the MHC protein. This latter point indicates:
(Multiple Choice)
4.9/5 (37)
The MHC locus encodes a large number of genes spanning over four million bp of DNA. These include many genes involved in antigen processing and presentation, as well as receptors recognized by non-conventional T cells and natural killer (NK) cells. In addition, the MHC locus encodes genes with no function in immunity at all.
(True/False)
4.8/5 (33)
In the 1980s, a mutant strain of mice was identified, carrying amino acid changes in the MHC class II gene. This mutant strain was derived from C57Bl/6 mice, which carry the H-2b haplotype. Inbred H-2b mice express only one MHC class II protein, called Ab. The mutant strain, called 'bm12' was found to have 3 amino acid changes in the Ab protein, at positions 67, 70, and 71 of the Aβ chain. The positions of these amino acid changes on the MHC class II structure are shown below by the red circles in Figure . On the right, the side view diagram of MHC class II shows the direction of these three amino acid side chains. 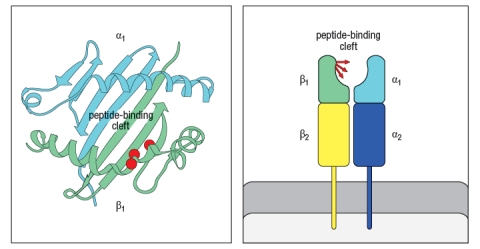 Initial experiments with wild-type C57Bl/6 mice and bm12 mice showed that the wild-type mice made a robust CD4 T cell response after immunization with the insulin protein isolated from a cow; in contrast, the bm12 mice failed to make any detectable response to this foreign protein. Epitope mapping studies identified amino acid residues 1–14 of the bovine insulin A chain as the peptide recognized by CD4 T cells from wild-type mice.
a) What is the most likely explanation for the failure of bm12 mice to make a CD4 T cell response to bovine insulin?
In a second set of experiments, T cells from wild-type (WT) or bm12 mice were mixed in vitro with antigen-presenting cells (APCs), in the presence or absence of the superantigen staphylococcal enterotoxin B (SEB), and T cell proliferation was measured. The data from these experiments are shown in Figure.
Initial experiments with wild-type C57Bl/6 mice and bm12 mice showed that the wild-type mice made a robust CD4 T cell response after immunization with the insulin protein isolated from a cow; in contrast, the bm12 mice failed to make any detectable response to this foreign protein. Epitope mapping studies identified amino acid residues 1–14 of the bovine insulin A chain as the peptide recognized by CD4 T cells from wild-type mice.
a) What is the most likely explanation for the failure of bm12 mice to make a CD4 T cell response to bovine insulin?
In a second set of experiments, T cells from wild-type (WT) or bm12 mice were mixed in vitro with antigen-presenting cells (APCs), in the presence or absence of the superantigen staphylococcal enterotoxin B (SEB), and T cell proliferation was measured. The data from these experiments are shown in Figure.
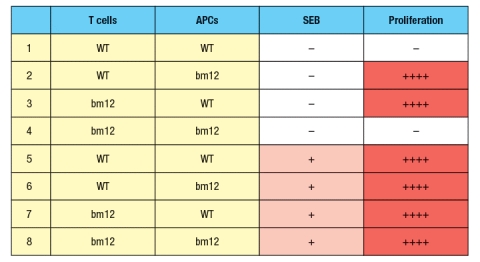 b) What is the explanation for the results in Rows 1–4 of the table?
c) Why does the T cell response to SEB (Rows 5–8) show a different pattern than the response to bovine insulin?
d) In the table above, T cell proliferation was measured after 4 days of incubation of T cells, APCs, +/- SEB. If one isolated the T cells at the end of the incubation for the six conditions in which robust proliferation was seen (Rows 2, 3, 5-8), and stained the T cells with each antibody (separately) from a panel of antibodies that recognize each of the mouse V domains (i.e., an antibody to V 1, an antibody to V 2, etc), what result would be expected?
b) What is the explanation for the results in Rows 1–4 of the table?
c) Why does the T cell response to SEB (Rows 5–8) show a different pattern than the response to bovine insulin?
d) In the table above, T cell proliferation was measured after 4 days of incubation of T cells, APCs, +/- SEB. If one isolated the T cells at the end of the incubation for the six conditions in which robust proliferation was seen (Rows 2, 3, 5-8), and stained the T cells with each antibody (separately) from a panel of antibodies that recognize each of the mouse V domains (i.e., an antibody to V 1, an antibody to V 2, etc), what result would be expected?
(Essay)
4.7/5 (40)
Multiple mechanisms contribute to create a wide diversity in MHC protein expression between different individuals in the population. In addition to the genetic polymorphism of MHC genes, what additional mechanism(s) contribute to this diversity?
(Essay)
4.9/5 (36)
The MARCH-1 E3-ubiquitin ligase is expressed in B cells, dendritic cells, and macrophages. The pathway regulated by MARCH-1 is targeted by some pathogens in an immune evasion strategy. In this strategy, the pathogens encode:
(Multiple Choice)
4.9/5 (33)
The diagram in Figure shows a pathogen (in red) that is present in different cellular compartments of each of the cell types shown. In each case, a specific T cell subset will recognize peptides of that pathogen presented on MHC molecules on the surface of the cell, and will execute its effector function. From the list below, match the appropriate T cell effector response to the cell type and location of the pathogen. 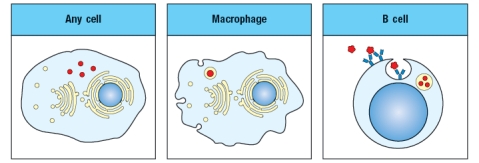 i. CD4 T cell killing of target cell
ii. CD8 T cell killing of target cell
iii. CD4 T cell activation of target cell's antibody production
iv. CD8 T cell activation of target cell's antibody production
v. CD4 T cell activation of target cell's ability to kill intracellular pathogen
vi. CD8 T cell activation of target cell's ability to kill intracellular pathogen
i. CD4 T cell killing of target cell
ii. CD8 T cell killing of target cell
iii. CD4 T cell activation of target cell's antibody production
iv. CD8 T cell activation of target cell's antibody production
v. CD4 T cell activation of target cell's ability to kill intracellular pathogen
vi. CD8 T cell activation of target cell's ability to kill intracellular pathogen
(Short Answer)
4.8/5 (43)
Filters
- Essay(0)
- Multiple Choice(0)
- Short Answer(0)
- True False(0)
- Matching(0)