Exam 10: Comparisons Involving Means, Experimental Design, and Analysis of Variance
Exam 1: Data and Statistics84 Questions
Exam 2: Descriptive Statistics: Tabular and Graphical Presentations116 Questions
Exam 3: Descriptive Statistics: Numerical Measures130 Questions
Exam 4: Introduction to Probability127 Questions
Exam 5: Discrete Probability Distributions146 Questions
Exam 6: Continuous Probability Distributions138 Questions
Exam 7: Sampling and Sampling Distributions123 Questions
Exam 8: Interval Estimation111 Questions
Exam 9: Hypothesis Tests117 Questions
Exam 10: Comparisons Involving Means, Experimental Design, and Analysis of Variance184 Questions
Exam 11: Comparisons Involving Proportions and a Test of Independence117 Questions
Exam 12: Simple Linear Regression107 Questions
Exam 13: Multiple Regression111 Questions
Exam 14: Statistical Methods for Quality Control72 Questions
Exam 15: Time Series Analysis and Forecastng75 Questions
Select questions type
Three different models of automobiles (A, B, and C) were compared for gasoline consumption. For each model of car, ten cars were randomly selected and subjected to standard driving procedures. The average miles/gallon obtained for each model of car and sample standard deviations are shown below.
 Use the above data and test to see if the mean gasoline consumption for all three models of cars is the same. Let 0.05. Show the complete ANOVA table.
(Essay)
4.8/5  (36)
(36)
Exhibit 10-16
 -Refer to Exhibit 10-16. The null hypothesis
(Multiple Choice)
4.8/5 (31)
Independent random samples of Company W employees were taken to compare salaries between college graduates and high school graduates. Samples of size 30 were taken for each group. The results follow.
 Use Excel to estimate the difference in average salaries between the two groups with a 95% level of confidence.
(Essay)
4.8/5 (47)
Ten observations were selected from each of 3 populations, and an analysis of variance was performed on the data. The following are the results.
 At 95% confidence, test to see if there is a significant difference among the means of the three populations.
(Essay)
4.8/5 (32)
An ANOVA procedure is used for data that was obtained from four sample groups each comprised of five observations. The degrees of freedom for the critical value of F are
(Multiple Choice)
4.8/5 (31)
Guitars R. US has three stores located in three different areas. Random samples of the sales of the three stores (in $1000) are shown below.
 a.Compute the overall sample mean.
b.At 95% confidence, test to see if there is a significant difference in the average sales of the three stores. Set up the complete ANOVA table. Please note that the sample sizes are not equal.
a.Compute the overall sample mean.
b.At 95% confidence, test to see if there is a significant difference in the average sales of the three stores. Set up the complete ANOVA table. Please note that the sample sizes are not equal.
(Essay)
4.9/5 (39)
Exhibit 10-12
In a completely randomized experimental design involving five treatments, 13 observations were recorded for each of the five treatments (a total of 65 observations). The following information is provided.
 -Refer to Exhibit 10-12. The sum of squares within treatments (SSE) is
(Multiple Choice)
5.0/5 (44)
Exhibit 10-15
The following is part of an ANOVA table that was obtained from data regarding three treatments and a total of 15 observations.
 -Refer to Exhibit 10-15. The mean square between treatments (MSTR) is
(Multiple Choice)
4.8/5 (34)
Exhibit 10-13
Part of an ANOVA table is shown below.
 -Refer to Exhibit 10-13. If at 95% confidence, we want to determine whether or not the means of the populations are equal, the p-value is
(Multiple Choice)
4.8/5 (29)
The following data present the number of computer units sold per day by a sample of 6 salespersons before and after a bonus plan was implemented. Let d = before - after.
 At 95% confidence, test to see if the bonus plan was effective. That is, did the bonus plan actually increase sales?
(Essay)
4.9/5 (28)
Exhibit 10-11
To test whether or not there is a difference between treatments A, B, and C, a sample of 12 observations has been randomly assigned to the 3 treatments. You are given the results below.
 -Refer to Exhibit 10-11. The null hypothesis
(Multiple Choice)
4.8/5 (34)
Exhibit 10-10
A local department store is studying the shopping habits of its customers. They think that the longer customers spend in the store the more they buy. Their study resulted in the following information regarding the amount of time women and men spent in a store.
 -Refer to Exhibit 10-10. At 95% confidence, what is the conclusion for this study?
(Multiple Choice)
4.9/5 (36)
Random samples were selected from three populations. The data obtained are shown below.
 a.Compute the overall sample mean.
b.At 95% confidence, test to see if there is a significant difference in the means of the three populations. Show the complete ANOVA table. Please note that the sample sizes are not equal.
a.Compute the overall sample mean.
b.At 95% confidence, test to see if there is a significant difference in the means of the three populations. Show the complete ANOVA table. Please note that the sample sizes are not equal.
(Essay)
4.8/5 (33)
Exhibit 10-8
In order to determine whether or not there is a significant difference between the hourly wages of two companies, the following data have been accumulated.
 -Refer to Exhibit 10-8. The null hypothesis
(Multiple Choice)
4.7/5 (33)
The final examination grades of random samples of students from three different classes are shown below.
 At the .05 level of significance, is there any difference in the mean grades of the three classes? Show the complete ANOVA table.
(Essay)
4.9/5 (30)
If two independent large samples are taken from two populations, the sampling distribution of the difference between the two sample means
(Multiple Choice)
4.9/5 (28)
The management of Recover Fast Hospital (RFH) claims that the average length of stay in their hospital after a major surgery is less than the average length of stay at General Hospital (GH). The following data have been accumulated to test their claim.
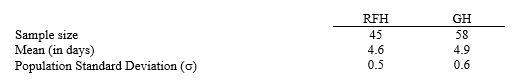 a.Formulate the hypotheses.
b.Compute the test statistic.
c.Using the p-value approach, test to see if the average length of stay in RFH is significantly less than the average length of stay in GH. Let 0.05.
a.Formulate the hypotheses.
b.Compute the test statistic.
c.Using the p-value approach, test to see if the average length of stay in RFH is significantly less than the average length of stay in GH. Let 0.05.
(Essay)
4.9/5 (36)
Exhibit 10-15
The following is part of an ANOVA table that was obtained from data regarding three treatments and a total of 15 observations.
-Refer to Exhibit 10-15. The number of degrees of freedom corresponding to between treatments is
(Multiple Choice)
4.8/5 (33)
Maxforce, Inc. manufactures racquetball racquets by two different manufacturing processes (A and B). Because the management of this company is interested in estimating the difference between the average time it takes each process to produce a racquet, they select independent samples from each process. The results of the samples are shown below.
 a.Develop a 95% confidence interval estimate for the difference between the average times of the two processes.
b.Is there conclusive evidence to prove that one process takes longer than the other? If yes, which process? Explain.
a.Develop a 95% confidence interval estimate for the difference between the average times of the two processes.
b.Is there conclusive evidence to prove that one process takes longer than the other? If yes, which process? Explain.
(Essay)
4.8/5 (32)
Filters
- Essay(0)
- Multiple Choice(0)
- Short Answer(0)
- True False(0)
- Matching(0)