Exam 10: Comparisons Involving Means, Experimental Design, and Analysis of Variance
Exam 1: Data and Statistics84 Questions
Exam 2: Descriptive Statistics: Tabular and Graphical Presentations116 Questions
Exam 3: Descriptive Statistics: Numerical Measures130 Questions
Exam 4: Introduction to Probability127 Questions
Exam 5: Discrete Probability Distributions146 Questions
Exam 6: Continuous Probability Distributions138 Questions
Exam 7: Sampling and Sampling Distributions123 Questions
Exam 8: Interval Estimation111 Questions
Exam 9: Hypothesis Tests117 Questions
Exam 10: Comparisons Involving Means, Experimental Design, and Analysis of Variance184 Questions
Exam 11: Comparisons Involving Proportions and a Test of Independence117 Questions
Exam 12: Simple Linear Regression107 Questions
Exam 13: Multiple Regression111 Questions
Exam 14: Statistical Methods for Quality Control72 Questions
Exam 15: Time Series Analysis and Forecastng75 Questions
Select questions type
Exhibit 10-8
In order to determine whether or not there is a significant difference between the hourly wages of two companies, the following data have been accumulated.
 -Refer to Exhibit 10-8. A point estimate for the difference between the two sample means is
(Multiple Choice)
4.8/5  (36)
(36)
The following shows the monthly sales in units of six salespersons before and after a bonus plan was introduced. At 95% confidence, determine whether the bonus plan has increased sales significantly. (For the following matched samples, let the difference "d" be: d after before.)

(Essay)
4.9/5 (39)
Exhibit 10-16
 -Refer to Exhibit 10-16. The mean square between treatments (MSTR) equals
(Multiple Choice)
4.8/5 (29)
Exhibit 10-1
Salary information regarding male and female employees of a large company is shown below.
 -Refer to Exhibit 10-1. The p-value is
(Multiple Choice)
4.8/5 (39)
Exhibit 10-6
The management of a department store is interested in estimating the difference between the mean credit purchases of customers using the store's credit card versus those customers using a national major credit card. You are given the following information.
 -Refer to Exhibit 10-6. At 95% confidence, the margin of error is
(Multiple Choice)
4.9/5 (39)
Exhibit 10-3
A statistics teacher wants to see if there is any difference in the abilities of students enrolled in statistics today and those enrolled five years ago. A sample of final examination scores from students enrolled today and from students enrolled five years ago was taken. You are given the following information.
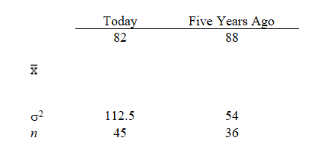 -Refer to Exhibit 10-3. The test statistic for the difference between the two population means is
(Multiple Choice)
4.9/5 (36)
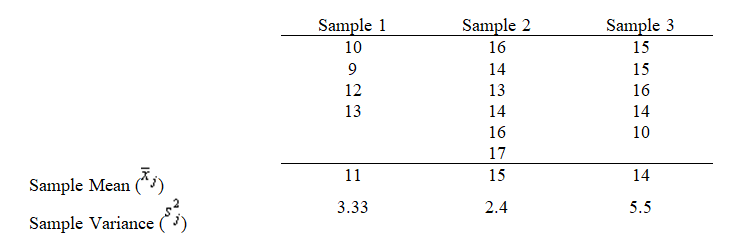
MOA, Inc. has three stores located in three different areas. Random samples of the sales of the three stores (In $1,000) are shown below.
 a.Compute the overall sample mean.
b.At 95% confidence, test to see if there is a significant difference in the average sales of the three stores. Show the complete ANOVA table.
a.Compute the overall sample mean.
b.At 95% confidence, test to see if there is a significant difference in the average sales of the three stores. Show the complete ANOVA table.
(Essay)
4.8/5 (41)
An ANOVA procedure is used for data obtained from four populations. Four samples, each comprised of 30 observations, were taken from the four populations. The numerator and denominator (respectively) degrees of freedom for the critical value of F are
(Multiple Choice)
4.8/5 (36)
Individuals were randomly assigned to three different production processes. The hourly units of production for the three processes are shown below.
 Use the analysis of variance procedure with 0.05 to determine if there is a significant difference in the mean hourly units of production for the three types of production processes. Show the complete ANOVA table.
(Essay)
4.9/5 (33)
Exhibit 10-10
A local department store is studying the shopping habits of its customers. They think that the longer customers spend in the store the more they buy. Their study resulted in the following information regarding the amount of time women and men spent in a store.
 -Refer to Exhibit 10-10. The test statistic for the difference between the two population means is
(Multiple Choice)
4.8/5 (34)
Which of the following is not a required assumption for the analysis of variance?
(Multiple Choice)
4.8/5 (35)
Samples were selected from three populations. The data obtained are shown below.
 a.Compute the overall sample mean.
b.Set up an ANOVA table for this problem.
c.At 95% confidence test to determine whether there is a significant difference in the means of the three populations.
a.Compute the overall sample mean.
b.Set up an ANOVA table for this problem.
c.At 95% confidence test to determine whether there is a significant difference in the means of the three populations.
(Essay)
5.0/5 (34)
Exhibit 10-4
The following information was obtained from independent random samples.
Assume normally distributed populations with equal variances.
 -Refer to Exhibit 10-4. The point estimate for the difference between the means of the two populations is
(Multiple Choice)
4.8/5 (34)
Exhibit 10-12
In a completely randomized experimental design involving five treatments, 13 observations were recorded for each of the five treatments (a total of 65 observations). The following information is provided.
 -Refer to Exhibit 10-12. If at 95% confidence we want to determine whether or not the means of the five populations are equal, the p-value is
(Multiple Choice)
4.8/5 (31)
Exhibit 10-8
In order to determine whether or not there is a significant difference between the hourly wages of two companies, the following data have been accumulated.
-Refer to Exhibit 10-8. The p-value is
(Multiple Choice)
4.7/5 (29)
Samples of employees of Companies A and B provided the following information regarding the ages of employees.
 Develop a 97% confidence interval for the difference between the average ages of the employees of the two companies.
(Short Answer)
4.7/5 (33)
A credit company has gathered information regarding the average amount owed by people under 30 years old and by people over 30 years. Independent random samples were taken from both age groups. You are given the following information.
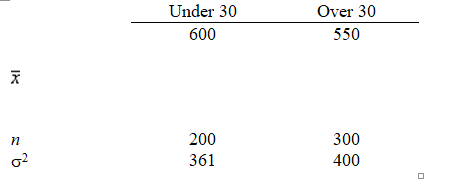 Construct a 95% confidence interval for the difference between the average amounts owed by the two age groups.
(Short Answer)
4.9/5 (30)
Independent random samples taken at two companies provided the following information regarding annual salaries of the employees.
 a.We want to determine whether or not there is a significant difference between the average salaries of the employees at the two companies. Compute the test statistic.
b.Compute the p-value; and at 95% confidence, test the hypotheses.
a.We want to determine whether or not there is a significant difference between the average salaries of the employees at the two companies. Compute the test statistic.
b.Compute the p-value; and at 95% confidence, test the hypotheses.
(Essay)
4.8/5 (48)
Exhibit 10-11
To test whether or not there is a difference between treatments A, B, and C, a sample of 12 observations has been randomly assigned to the 3 treatments. You are given the results below.
 -Refer to Exhibit 10-11. The test statistic to test the null hypothesis equals
(Multiple Choice)
4.9/5 (38)
Filters
- Essay(0)
- Multiple Choice(0)
- Short Answer(0)
- True False(0)
- Matching(0)