Exam 10: Comparisons Involving Means, Experimental Design, and Analysis of Variance
Exam 1: Data and Statistics84 Questions
Exam 2: Descriptive Statistics: Tabular and Graphical Presentations116 Questions
Exam 3: Descriptive Statistics: Numerical Measures130 Questions
Exam 4: Introduction to Probability127 Questions
Exam 5: Discrete Probability Distributions146 Questions
Exam 6: Continuous Probability Distributions138 Questions
Exam 7: Sampling and Sampling Distributions123 Questions
Exam 8: Interval Estimation111 Questions
Exam 9: Hypothesis Tests117 Questions
Exam 10: Comparisons Involving Means, Experimental Design, and Analysis of Variance184 Questions
Exam 11: Comparisons Involving Proportions and a Test of Independence117 Questions
Exam 12: Simple Linear Regression107 Questions
Exam 13: Multiple Regression111 Questions
Exam 14: Statistical Methods for Quality Control72 Questions
Exam 15: Time Series Analysis and Forecastng75 Questions
Select questions type
In order to compare the life expectancies of three different brands of printers, eight printers of each brand were randomly selected. Information regarding the three brands is shown below.
 Use the above data and test to see if the mean life expectancies of the three brands are the same. Let 0.05. Show the complete ANOVA table.
(Essay)
4.9/5  (32)
(32)
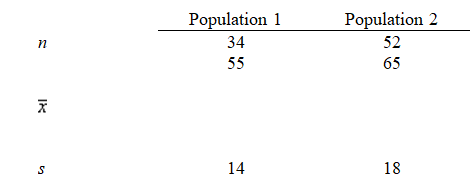
Consider the following results for two samples randomly taken from two populations.
 a.What are the degrees of freedom for the t distribution?
b.At 95% confidence, compute the margin of error.
c.Develop a 95% confidence interval for the difference between the two population means.
a.What are the degrees of freedom for the t distribution?
b.At 95% confidence, compute the margin of error.
c.Develop a 95% confidence interval for the difference between the two population means.
(Essay)
4.9/5 (40)
Exhibit 10-3
A statistics teacher wants to see if there is any difference in the abilities of students enrolled in statistics today and those enrolled five years ago. A sample of final examination scores from students enrolled today and from students enrolled five years ago was taken. You are given the following information.
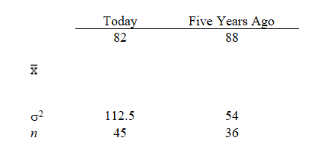 -Refer to Exhibit 10-3. The standard error of
  is
is
(Multiple Choice)
4.7/5 (39)
Exhibit 10-11
To test whether or not there is a difference between treatments A, B, and C, a sample of 12 observations has been randomly assigned to the 3 treatments. You are given the results below.
 -Refer to Exhibit 10-11. The null hypothesis is to be tested at the 1% level of significance. The p-value is
(Multiple Choice)
4.8/5 (37)
Exhibit 10-12
In a completely randomized experimental design involving five treatments, 13 observations were recorded for each of the five treatments (a total of 65 observations). The following information is provided.
 -Refer to Exhibit 10-12. The mean square within treatments (MSE) is
(Multiple Choice)
4.8/5 (31)
Exhibit 10-8
In order to determine whether or not there is a significant difference between the hourly wages of two companies, the following data have been accumulated.
 -Refer to Exhibit 10-8. The test statistic is
(Multiple Choice)
4.8/5 (35)
Exhibit 10-1
Salary information regarding male and female employees of a large company is shown below.
 -Refer to Exhibit 10-1. If you are interested in testing whether or not the average salary of males is significantly greater than that of females, the test statistic is
(Multiple Choice)
4.8/5 (36)
Two independent samples are drawn from two populations, and the following information is provided.
 We want to test the following hypotheses.
Ho: 1 2 0
Ha: 1 2 0
a.Determine the degrees of freedom.
b.Compute the test statistic.
c.At 95% confidence, test the hypotheses. Assume the two populations are normally distributed and have equal variances.
We want to test the following hypotheses.
Ho: 1 2 0
Ha: 1 2 0
a.Determine the degrees of freedom.
b.Compute the test statistic.
c.At 95% confidence, test the hypotheses. Assume the two populations are normally distributed and have equal variances.
(Essay)
4.7/5 (40)
When each data value in one sample is matched with a corresponding data value in another sample, the samples are known as
(Multiple Choice)
4.8/5 (25)
Independent random samples taken on two university campuses revealed the following information concerning the average amount of money spent on non-textbook purchases at the university's bookstore during the fall semester.
 We want to determine if, on the average, students at University A spent more on non-textbook purchases at the university's bookstore than the students at University B.
a.Compute the test statistic.
b.Compute the p-value.
c.What is your conclusion? Let .05.
We want to determine if, on the average, students at University A spent more on non-textbook purchases at the university's bookstore than the students at University B.
a.Compute the test statistic.
b.Compute the p-value.
c.What is your conclusion? Let .05.
(Essay)
4.8/5 (35)
Exhibit 10-12
In a completely randomized experimental design involving five treatments, 13 observations were recorded for each of the five treatments (a total of 65 observations). The following information is provided.
-Refer to Exhibit 10-12. The mean square between treatments (MSTR) is
(Multiple Choice)
4.8/5 (37)
Eight observations were selected from each of 3 populations (total of 24 observations), and an analysis of variance was performed on the data. The following are part of the results.
 Using .05, test to see if there is a significant difference among the means of the three populations.
(Essay)
4.8/5 (48)
In analysis of variance, the independent variable of interest is called the
(Multiple Choice)
4.9/5 (37)
Exhibit 10-2
The following information was obtained from matched samples.
The daily production rates for a sample of workers before and after a training program are shown below.
 -Refer to Exhibit 10-2. The null hypothesis to be tested is H0: d 0. The test statistic is
(Multiple Choice)
4.9/5 (36)
The critical F value with 8 numerator and 29 denominator degrees of freedom at 0.01 is
(Multiple Choice)
4.8/5 (36)
Wendy, Inc. has three stores located in three different areas. Random samples of the sales of the three stores (in $1,000) are shown below.
 a.Compute the overall sample mean.
b.At 95% confidence, test to see if there is a significant difference in the average sales of the three stores. Note that the sample sizes are not equal. Show your complete work and the ANOVA table.
a.Compute the overall sample mean.
b.At 95% confidence, test to see if there is a significant difference in the average sales of the three stores. Note that the sample sizes are not equal. Show your complete work and the ANOVA table.
(Essay)
4.9/5 (29)
If we are interested in testing whether the mean of population 1 is significantly smaller than the mean of population 2, the
(Multiple Choice)
4.8/5 (36)
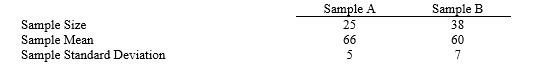
The Dean of Students at UTC has said that the average grade of UTC students is higher than that of the students at GSU. Random samples of grades from the two schools are selected, and the results are shown below.
 a.Give the hypotheses.
b.Compute the test statistic.
c.At a 0.1 level of significance, test the Dean of Students' statement.
a.Give the hypotheses.
b.Compute the test statistic.
c.At a 0.1 level of significance, test the Dean of Students' statement.
(Essay)
4.7/5 (38)
In order to determine whether or not the means of two populations are equal,
(Multiple Choice)
4.8/5 (38)
Exhibit 10-13
Part of an ANOVA table is shown below.
 -Refer to Exhibit 10-13. The mean square between treatments (MSTR) is
(Multiple Choice)
4.8/5 (37)
Filters
- Essay(0)
- Multiple Choice(0)
- Short Answer(0)
- True False(0)
- Matching(0)