Exam 10: Comparisons Involving Means, Experimental Design, and Analysis of Variance
Exam 1: Data and Statistics84 Questions
Exam 2: Descriptive Statistics: Tabular and Graphical Presentations116 Questions
Exam 3: Descriptive Statistics: Numerical Measures130 Questions
Exam 4: Introduction to Probability127 Questions
Exam 5: Discrete Probability Distributions146 Questions
Exam 6: Continuous Probability Distributions138 Questions
Exam 7: Sampling and Sampling Distributions123 Questions
Exam 8: Interval Estimation111 Questions
Exam 9: Hypothesis Tests117 Questions
Exam 10: Comparisons Involving Means, Experimental Design, and Analysis of Variance184 Questions
Exam 11: Comparisons Involving Proportions and a Test of Independence117 Questions
Exam 12: Simple Linear Regression107 Questions
Exam 13: Multiple Regression111 Questions
Exam 14: Statistical Methods for Quality Control72 Questions
Exam 15: Time Series Analysis and Forecastng75 Questions
Select questions type
Exhibit 10-5
The following information was obtained from matched samples.
 -Refer to Exhibit 10-5. If the null hypothesis is tested at the 5% level, the null hypothesis
(Multiple Choice)
4.8/5  (31)
(31)
Exhibit 10-15
The following is part of an ANOVA table that was obtained from data regarding three treatments and a total of 15 observations.
 -Refer to Exhibit 10-15. The computed test statistics is
(Multiple Choice)
4.9/5 (30)
Exhibit 10-5
The following information was obtained from matched samples.
-Refer to Exhibit 10-5. The 95% confidence interval for the difference between the two population means is
(Multiple Choice)
4.9/5 (36)
In order to estimate the difference between the average mortgages in the southern states and the northern states, the following information was gathered.
 a.Compute the degrees of freedom for the t distribution.
b.Develop an interval estimate for the difference between the average of the mortgages in the South and North. Let alpha 0.05.
a.Compute the degrees of freedom for the t distribution.
b.Develop an interval estimate for the difference between the average of the mortgages in the South and North. Let alpha 0.05.
(Essay)
4.8/5 (35)
Exhibit 10-2
The following information was obtained from matched samples.
The daily production rates for a sample of workers before and after a training program are shown below.
 -Refer to Exhibit 10-2. The point estimate for the difference between the means of the two populations is
(Multiple Choice)
4.7/5 (40)
The required condition for using an ANOVA procedure on data from several populations is that the
(Multiple Choice)
4.8/5 (37)
In a completely randomized experimental design, 11 experimental units were used for each of the 3 treatments. Part of the ANOVA table is shown below.
 a.Fill in the blanks in the above ANOVA table.
b.At 95% confidence, test to determine whether or not the means of the 3 populations are equal.
a.Fill in the blanks in the above ANOVA table.
b.At 95% confidence, test to determine whether or not the means of the 3 populations are equal.
(Essay)
4.9/5 (33)
Exhibit 10-15
The following is part of an ANOVA table that was obtained from data regarding three treatments and a total of 15 observations.
-Refer to Exhibit 10-15. If at 95% confidence, we want to determine whether or not the means of the populations are equal, the p-value is
(Multiple Choice)
4.8/5 (39)
Exhibit 10-5
The following information was obtained from matched samples.
-Refer to Exhibit 10-5. The point estimate for the difference between the means of the two populations (method 1 method 2) is
(Multiple Choice)
4.9/5 (27)
Exhibit 10-10
A local department store is studying the shopping habits of its customers. They think that the longer customers spend in the store the more they buy. Their study resulted in the following information regarding the amount of time women and men spent in a store.
 -Refer to Exhibit 10-10. The point estimate for the difference between the means of the two populations is
(Multiple Choice)
4.8/5 (41)
Two independent random samples of annual starting salaries for individuals with masters and bachelors degrees in business were taken and the results are shown below.
 a.What are the degrees of freedom for the t distribution?
b.Provide a 95% confidence interval estimate for the difference between the salaries of the two groups.
a.What are the degrees of freedom for the t distribution?
b.Provide a 95% confidence interval estimate for the difference between the salaries of the two groups.
(Essay)
4.9/5 (42)
The test scores for selected samples of statistics students who took the course from three different instructors are shown below.
 At 0.05, test to see if there is a significant difference among the averages of the three groups. Show the complete ANOVA table.
(Essay)
5.0/5 (37)
In an analysis of variance problem if SST 120 and SSTR 80, then SSE is
(Multiple Choice)
4.9/5 (37)
Information regarding the ACT scores of samples of students in four different majors is given below.
 a.Set up the ANOVA table for this problem.
b.At 95% confidence, test to determine whether there is a significant difference in the means of the three populations.
a.Set up the ANOVA table for this problem.
b.At 95% confidence, test to determine whether there is a significant difference in the means of the three populations.
(Essay)
4.9/5 (23)
At a particular airport in the United States, independent samples of domestic flights from two airlines were taken and the amount of time each flight was delayed was measured. The results follow.
 Use Excel to estimate the difference in average delay time between the two airlines with a 95% level of confidence.
(Essay)
4.8/5 (34)
The following information regarding the ages of full-time and part-time students are given. Using the following data, develop an interval estimate for the difference between the mean ages of the two populations. Use a 5% level of significance. The degrees of freedom for the t distribution are 106.
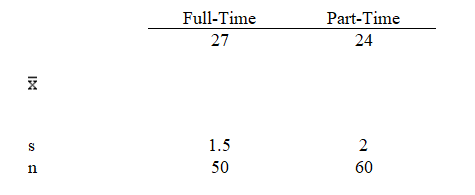
(Short Answer)
4.9/5 (35)
A random sample of 89 tourists in the Grand Bahamas showed that they spent an average of $2,860 (in a week) with a standard deviation of $126; and a sample of 64 tourists in New Province showed that they spent an average of $2,935 (in a week) with a standard deviation of $138. We are interested in determining if there is any significant difference between the average expenditures of those who visited the two islands?
a.Determine the degrees of freedom for this test.
b.Compute the test statistic.
c.Compute the p-value.
d.What is your conclusion? Let .05.
(Essay)
4.9/5 (52)
Independent random samples taken at two local malls provided the following information regarding purchases by patrons of the two malls.
 We want to determine whether or not there is a significant difference between the average purchases by the patrons of the two malls.
a.Give the hypotheses for the above.
b.Compute the test statistic.
c.At 95% confidence, test the hypotheses.
We want to determine whether or not there is a significant difference between the average purchases by the patrons of the two malls.
a.Give the hypotheses for the above.
b.Compute the test statistic.
c.At 95% confidence, test the hypotheses.
(Essay)
4.7/5 (29)
Exhibit 10-9
Two major automobile manufacturers have produced compact cars with the same size engines. We are interested in determining whether or not there is a significant difference in the MPG (miles per gallon) of the two brands of automobiles. A random sample of eight cars from each manufacturer is selected, and eight drivers are selected to drive each automobile for a specified distance. The following data show the results of the test.
 -Refer to Exhibit 10-9. The test statistic is
(Multiple Choice)
4.7/5 (37)
In order to estimate the difference between the average Miles per Gallon of two different models of automobiles, samples are taken and the following information is collected.
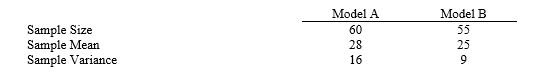 a.At 95% confidence develop an interval estimate for the difference between the average Miles per Gallon for the two models.
b.Is there conclusive evidence to indicate that one model gets a higher MPG than the other? Why or why not? Explain.
a.At 95% confidence develop an interval estimate for the difference between the average Miles per Gallon for the two models.
b.Is there conclusive evidence to indicate that one model gets a higher MPG than the other? Why or why not? Explain.
(Essay)
4.9/5 (35)
Filters
- Essay(0)
- Multiple Choice(0)
- Short Answer(0)
- True False(0)
- Matching(0)