Exam 10: Comparisons Involving Means, Experimental Design, and Analysis of Variance
Exam 1: Data and Statistics84 Questions
Exam 2: Descriptive Statistics: Tabular and Graphical Presentations116 Questions
Exam 3: Descriptive Statistics: Numerical Measures130 Questions
Exam 4: Introduction to Probability127 Questions
Exam 5: Discrete Probability Distributions146 Questions
Exam 6: Continuous Probability Distributions138 Questions
Exam 7: Sampling and Sampling Distributions123 Questions
Exam 8: Interval Estimation111 Questions
Exam 9: Hypothesis Tests117 Questions
Exam 10: Comparisons Involving Means, Experimental Design, and Analysis of Variance184 Questions
Exam 11: Comparisons Involving Proportions and a Test of Independence117 Questions
Exam 12: Simple Linear Regression107 Questions
Exam 13: Multiple Regression111 Questions
Exam 14: Statistical Methods for Quality Control72 Questions
Exam 15: Time Series Analysis and Forecastng75 Questions
Select questions type
Independent simple random samples are taken to test the difference between the means of two populations whose variances are not known. The sample sizes are n1 = 32 and n2 = 40. The correct distribution to use is the
(Multiple Choice)
4.9/5  (41)
(41)
In a completely randomized experimental design, 18 experimental units were used for the first treatment, 10 experimental units for the second treatment, and 15 experimental units for the third treatment. Part of the ANOVA table for this experiment is shown below.
 a.Fill in all the blanks in the above ANOVA table.
b.At 95% confidence, test to see if there is a significant difference among the means.
a.Fill in all the blanks in the above ANOVA table.
b.At 95% confidence, test to see if there is a significant difference among the means.
(Essay)
4.9/5 (39)
In a completely randomized experimental design, 7 experimental units were used for the first treatment, 9 experimental units for the second treatment, and 14 experimental units for the third treatment. Part of the ANOVA table for this experiment is shown below.
 a.Fill in all the blanks in the above ANOVA table.
b.At 95% confidence, test to see if there is a significant difference among the means.
a.Fill in all the blanks in the above ANOVA table.
b.At 95% confidence, test to see if there is a significant difference among the means.
(Essay)
4.8/5 (33)
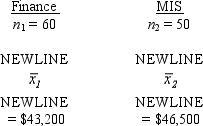
Starting annual salaries for business school graduates majoring in finance and management information systems (MIS) were collected in two independent random samples. Based on previous studies, the population standard deviations for Finance and MIS salaries are estimated to be $2,100 and $2,600, respectively. Use the following data to develop a 95% confidence interval estimate of the difference between the starting salaries for the two majors.
(Essay)
4.9/5 (29)
In a completely randomized design involving four treatments, the following information is provided.  The overall mean (the grand mean) for all treatments is
(Multiple Choice)
4.7/5 (22)
Exhibit 10-16
 -Refer to Exhibit 10-16. The test statistic to test the null hypothesis equals
(Multiple Choice)
4.8/5 (38)
Exhibit 10-15
The following is part of an ANOVA table that was obtained from data regarding three treatments and a total of 15 observations.
 -Refer to Exhibit 10-15. The conclusion of the test is that the means
(Multiple Choice)
4.8/5 (34)
Exhibit 10-4
The following information was obtained from independent random samples.
Assume normally distributed populations with equal variances.
 -Refer to Exhibit 10-4. The 95% confidence interval for the difference between the two population means is
(Multiple Choice)
4.8/5 (32)
A dietician wants to see if there is any difference in the effectiveness of three diets. Eighteen people were randomly chosen for the test. Then each individual was randomly assigned to one of the three diets. Below you are given the total amount of weight lost in a six-month period by each person.
 a.State the null and alternative hypotheses.
b.Prepare an ANOVA.
c.At 95% confidence test to determine if there is a significant difference in the means of the three populations.
a.State the null and alternative hypotheses.
b.Prepare an ANOVA.
c.At 95% confidence test to determine if there is a significant difference in the means of the three populations.
(Essay)
4.9/5 (39)
Exhibit 10-9
Two major automobile manufacturers have produced compact cars with the same size engines. We are interested in determining whether or not there is a significant difference in the MPG (miles per gallon) of the two brands of automobiles. A random sample of eight cars from each manufacturer is selected, and eight drivers are selected to drive each automobile for a specified distance. The following data show the results of the test.
 -Refer to Exhibit 10-9. At 90% confidence the null hypothesis
(Multiple Choice)
4.9/5 (35)
MNM, Inc. has three stores located in three different areas. Random samples of the daily sales of the three stores (in $1,000) are shown below.
 At 95% confidence, test to see if there is a significant difference in the average sales of the three stores. Show the complete ANOVA table.
(Essay)
4.8/5 (31)
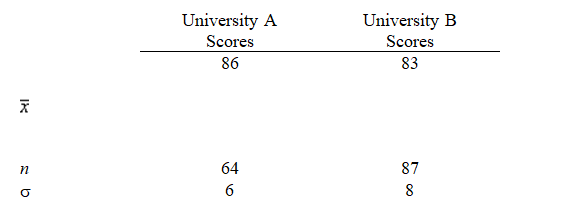
The following are the test scores of two samples of students from University A and University B on a national statistics examination. Develop a 95% confidence interval estimate for the difference between the mean scores of the two populations.
(Short Answer)
4.7/5 (36)
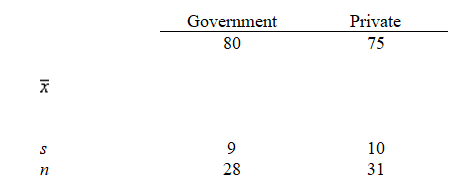
Independent random samples of managers' yearly salaries (in $1000) taken from governmental and private organizations provided the following information. At 95% confidence, test to determine if there is a significant difference between the average salaries of the managers in the two sectors.
(Essay)
4.9/5 (31)
The process of allocating the total sum of squares and degrees of freedom to the various components is referred to as
(Multiple Choice)
4.7/5 (31)
Exhibit 10-6
The management of a department store is interested in estimating the difference between the mean credit purchases of customers using the store's credit card versus those customers using a national major credit card. You are given the following information.
 -Refer to Exhibit 10-6. A point estimate for the difference between the mean purchases of the users of the two credit cards is
(Multiple Choice)
4.8/5 (36)
A manager is thinking of providing, on a regular basis, in-house training for employees preparing for an inventory management certification exam. In the past, some employees received the in-house training before taking the exam, while others did not. Independent random samples taken from the company's records provided the following exam scores for 10 workers who did not receive in-house training and 8 workers who did receive training. (The manager is confident that the distributions of both populations' exam scores are approximately normal.)
 a. Develop a 95% confidence interval estimate for the difference between the average test scores for the two populations of employees.
b. Using a = .05, test for any difference between the average test scores for the two populations of employees.
a. Develop a 95% confidence interval estimate for the difference between the average test scores for the two populations of employees.
b. Using a = .05, test for any difference between the average test scores for the two populations of employees.
(Essay)
4.8/5 (36)
The heating bills for a selected sample of houses using various forms of heating are given below (values are in dollars).
 At 0.05, test to see if there is a significant difference among the average bills of the homes. Show the complete ANOVA table.
(Essay)
4.8/5 (33)
Exhibit 10-1
Salary information regarding male and female employees of a large company is shown below.
 -Refer to Exhibit 10-1. The 95% confidence interval for the difference between the means of the two populations is
(Multiple Choice)
4.8/5 (36)
Exhibit 10-4
The following information was obtained from independent random samples.
Assume normally distributed populations with equal variances.
-Refer to Exhibit 10-4. The standard error of  is
is
(Multiple Choice)
4.8/5 (35)
To construct an interval estimate for the difference between the means of two populations when the standard deviations of the two populations are unknown, we must use a t distribution with (let n1 be the size of sample 1 and n2 the size of sample 2)
(Multiple Choice)
4.8/5 (31)
Filters
- Essay(0)
- Multiple Choice(0)
- Short Answer(0)
- True False(0)
- Matching(0)