Exam 10: Comparisons Involving Means, Experimental Design, and Analysis of Variance
Exam 1: Data and Statistics84 Questions
Exam 2: Descriptive Statistics: Tabular and Graphical Presentations116 Questions
Exam 3: Descriptive Statistics: Numerical Measures130 Questions
Exam 4: Introduction to Probability127 Questions
Exam 5: Discrete Probability Distributions146 Questions
Exam 6: Continuous Probability Distributions138 Questions
Exam 7: Sampling and Sampling Distributions123 Questions
Exam 8: Interval Estimation111 Questions
Exam 9: Hypothesis Tests117 Questions
Exam 10: Comparisons Involving Means, Experimental Design, and Analysis of Variance184 Questions
Exam 11: Comparisons Involving Proportions and a Test of Independence117 Questions
Exam 12: Simple Linear Regression107 Questions
Exam 13: Multiple Regression111 Questions
Exam 14: Statistical Methods for Quality Control72 Questions
Exam 15: Time Series Analysis and Forecastng75 Questions
Select questions type
Exhibit 10-12
In a completely randomized experimental design involving five treatments, 13 observations were recorded for each of the five treatments (a total of 65 observations). The following information is provided.
 -Refer to Exhibit 10-12. The number of degrees of freedom corresponding to within treatments is
(Multiple Choice)
4.9/5  (38)
(38)
A term that means the same as the term "variable" in an ANOVA procedure is
(Multiple Choice)
4.8/5 (41)
Random samples of employees from three different departments of MNM Corporation showed the following yearly incomes (in $1,000).
 At .05, test to determine if there is a significant difference among the average incomes of the employees from the three departments. Show the complete ANOVA table.
(Essay)
4.9/5 (41)
Allied Corporation is trying to determine whether to purchase Machine A or B. It has leased the two machines for a month. A random sample of 5 employees has been taken. These employees have gone through a training session on both machines. Below you are given information on their productivity rate on both machines. (Let d Machine A Machine B.)
 a.State the null and alternative hypotheses for a two-tailed test.
b.Find the mean and standard deviation for the difference.
c.Compute the test statistic.
d.Test the null hypothesis stated in Part a at the 10% level.
a.State the null and alternative hypotheses for a two-tailed test.
b.Find the mean and standard deviation for the difference.
c.Compute the test statistic.
d.Test the null hypothesis stated in Part a at the 10% level.
(Essay)
4.7/5 (26)
Exhibit 10-1
Salary information regarding male and female employees of a large company is shown below.
 -Refer to Exhibit 10-1. At 95% confidence, the margin of error is
(Multiple Choice)
4.8/5 (41)
Exhibit 10-3
A statistics teacher wants to see if there is any difference in the abilities of students enrolled in statistics today and those enrolled five years ago. A sample of final examination scores from students enrolled today and from students enrolled five years ago was taken. You are given the following information.
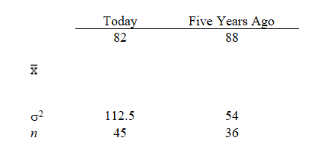 -Refer to Exhibit 10-3. The p-value for the difference between the two population means is
(Multiple Choice)
4.9/5 (26)
Exhibit 10-14
Part of an ANOVA table is shown below.
 -Refer to Exhibit 10-14. The mean square between treatments (MSTR) is
(Multiple Choice)
4.8/5 (30)
If we are interested in testing whether the mean of population 1 is significantly larger than the mean of population 2, the
(Multiple Choice)
4.9/5 (33)
Test scores on a standardized test from samples of students from two universities are given below.
 Provide a 98% confidence interval estimate for the difference between the test scores of the two universities.
(Short Answer)
4.8/5 (38)
Exhibit 10-10
A local department store is studying the shopping habits of its customers. They think that the longer customers spend in the store the more they buy. Their study resulted in the following information regarding the amount of time women and men spent in a store.
 -Refer to Exhibit 10-10. The point estimate for the standard deviation of the difference between the means of the two populations is
(Multiple Choice)
4.9/5 (33)
Exhibit 10-7
In order to estimate the difference between the average hourly wages of employees of two branches of a department store, the following data have been gathered.
 For this problem, the degrees of freedom are computed to be 36.
-Refer to Exhibit 10-7. A point estimate for the difference between the two sample means is
For this problem, the degrees of freedom are computed to be 36.
-Refer to Exhibit 10-7. A point estimate for the difference between the two sample means is
(Multiple Choice)
4.8/5 (31)
Regional Manager Sue Collins would like to know if the mean number of telephone calls made per 8-hour shift is the same for the telemarketers at her three call centers (Austin, Las Vegas, and Albuquerque). A simple random sample of 6 telemarketers from each of the three call centers was taken and the number of telephone calls made in eight hours by each observed employee is shown below.
 Using a = .10, test for any significant difference in the mean number of telephone calls made at the three call centers.
(Essay)
4.9/5 (31)
In analysis of variance, the dependent variable is called the
(Multiple Choice)
4.8/5 (33)
Exhibit 10-11
To test whether or not there is a difference between treatments A, B, and C, a sample of 12 observations has been randomly assigned to the 3 treatments. You are given the results below.
 -Refer to Exhibit 10-11. The mean square within treatments (MSE) equals
(Multiple Choice)
4.8/5 (31)
The daily production rates for a sample of factory workers before and after a training program are shown below. Let d = After - Before.
 We want to determine if the training program was effective.
a.Give the hypotheses for this problem.
b.Compute the test statistic.
c.At 95% confidence, test the hypotheses. That is, did the training program actually increase the production rates?
We want to determine if the training program was effective.
a.Give the hypotheses for this problem.
b.Compute the test statistic.
c.At 95% confidence, test the hypotheses. That is, did the training program actually increase the production rates?
(Essay)
4.8/5 (47)
Exhibit 10-6
The management of a department store is interested in estimating the difference between the mean credit purchases of customers using the store's credit card versus those customers using a national major credit card. You are given the following information.
 -Refer to Exhibit 10-6. A 95% confidence interval estimate for the difference between the average purchases of the customers using the two different credit cards is
(Multiple Choice)
4.9/5 (37)
The process of using the same or similar experimental units for all treatments in order to remove a source of variation from the error term is called
(Multiple Choice)
4.7/5 (41)
Exhibit 10-11
To test whether or not there is a difference between treatments A, B, and C, a sample of 12 observations has been randomly assigned to the 3 treatments. You are given the results below.
-Refer to Exhibit 10-11. The null hypothesis for this ANOVA problem is
(Multiple Choice)
5.0/5 (40)
A recent Time magazine reported the following information about a sample of workers in Germany and the United States.
 We want to determine whether or not there is a significant difference between the average workweek in the United States and the average workweek in Germany.
a.State the null and the alternative hypotheses.
b.Compute the test statistic.
c.Compute the p-value. What is your conclusion?
We want to determine whether or not there is a significant difference between the average workweek in the United States and the average workweek in Germany.
a.State the null and the alternative hypotheses.
b.Compute the test statistic.
c.Compute the p-value. What is your conclusion?
(Essay)
4.9/5 (36)
Exhibit 10-16
 -Refer to Exhibit 10-16. The null hypothesis is to be tested at the 5% level of significance. The p-value is
(Multiple Choice)
4.9/5 (33)
Filters
- Essay(0)
- Multiple Choice(0)
- Short Answer(0)
- True False(0)
- Matching(0)