Exam 9: Inference for Categorical Data
Exam 1: Looking at Datadistributions127 Questions
Exam 2: Looking at Datarelationships48 Questions
Exam 3: Producing Data70 Questions
Exam 4: Probability: the Study of Randomness93 Questions
Exam 5: Sampling Distributions77 Questions
Exam 6: Introduction to Inference89 Questions
Exam 7: Inference for Means103 Questions
Exam 8: Inference for Proportions101 Questions
Exam 9: Inference for Categorical Data122 Questions
Exam 10: Inference for Regression91 Questions
Exam 11: Multiple Regression95 Questions
Exam 12: One-Way Analysis of Variance74 Questions
Exam 13: Two-Way Analysis of Variance53 Questions
Exam 14: Logistic Regression53 Questions
Exam 15: Nonparametric Tests57 Questions
Exam 16: Bootstrap Methods and Permutation Tests42 Questions
Exam 17: Statistics for Quality: Control and Capability86 Questions
Select questions type
Even though Puerto Rico is a commonwealth of the United States,there are many cultural differences between the states on the continent and the island of Puerto Rico.These differences include the way consumers handle problems with purchases.Two researchers surveyed owners of DVD players in the Northeast United States and in Puerto Rico.They asked those who had experienced problems with their DVD players whether they complained.The results are given in the table below. 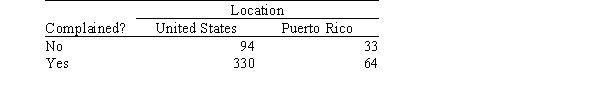 The SPSS output for the above table is given below.The output includes the cell counts,the expected cell counts,and the chi-square statistic.Expected counts are printed below observed counts.
 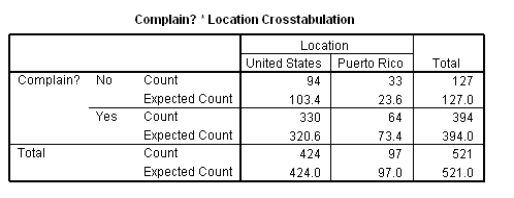 Chi-square = 0.855 + 3.744 + 0.276 + 1.204 = 6.079 What proportion of Americans did not complain?
(Multiple Choice)
5.0/5  (38)
(38)
A researcher is interested in determining if the model used for the distribution of main economic concerns in the year 2003 for residents in a certain county can still be used in the year 2004.A sample of 370 residents from that county was surveyed in 2004.The following table displays the model for the distribution of economic concerns for the year 2003 and the observed number of sampled respondents in the survey for the same economic concerns for the year 2004.  Under the null hypothesis that the model from the previous year can still be used,what is the value of the expected count of residents who would list housing as their main economic concern?
(Multiple Choice)
4.8/5 (37)
A researcher is interested in determining if the model used for the distribution of main economic concerns in the year 2003 for residents in a certain county can still be used in the year 2004.A sample of 370 residents from that county was surveyed in 2004.The following table displays the model for the distribution of economic concerns for the year 2003 and the observed number of sampled respondents in the survey for the same economic concerns for the year 2004. 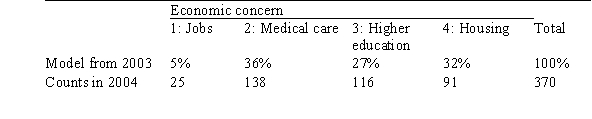 At the 5% significance level,which of the following statements represents the conclusion of this chi-square test under the null hypothesis that the model from the previous year can still be used?
(Multiple Choice)
4.9/5 (39)
How are the 2 statistic with 1 degree of freedom and the z statistic related?
(Essay)
4.7/5 (42)
Because statistical software plays such an important role in modern statistical applications,many studies have encouraged the use of technology in statistics courses.The Guidelines for the Assessment and Instruction in Statistics Education (GAISE)(Aliaga et al. ,2005)project was funded by the American Statistical Association to examine needs for college level statistics courses.One of the six recommendations from GAISE is the use of technology for developing conceptual understanding and analyzing data.A survey was sent to students at 100 different universities across the United States to access the relationship between ease of learning the statistical software program SAS and a student's currently level of SAS proficiency.The results of the survey are published in Jackson et al. ,2011,in the International Mathematical Forum journal and are shown below. Table 1.Two-way table for ease of learning SAS and SAS proficiency level. 
 What is the column proportion,I,for students who find SAS very easy to learn and who are very proficient in SAS?
(Multiple Choice)
4.7/5 (31)
A study was performed to examine the personal goals of children in grades 4,5,and 6.A random sample of students was selected from each of the grades 4,5,and 6 from schools in Georgia.The students received a questionnaire regarding achieving personal goals.They were asked what they would most like to do at school: make good grades,be good at sports,or be popular.Results are presented by the gender of the child in the table below. 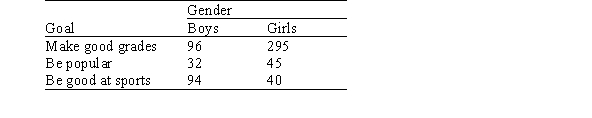 The data are going to be summarized by computing the conditional distributions of personal goals for boys and girls.What would be the entry for boys who like to make good grades?
(Multiple Choice)
4.9/5 (35)
What is the difference between a chi-square test for two-way tables and a chi-square test for a goodness-of-fit test?
(Multiple Choice)
4.8/5 (36)
The student newspaper called Campus Press polled a simple random sample of 280 undergraduate students in order to study student attitude toward a proposed change in dormitory regulations.Students responded as supporting,opposing,or standing neutral with regards to the issue.The numbers are displayed in the table below.  Under the appropriate null hypothesis,what is the value of the expected count for students who oppose the proposed change in dormitory regulations?
(Multiple Choice)
4.8/5 (42)
The Poisson distribution is a discrete distribution that expresses the probability of a fixed number of events occurring in a fixed interval.For example,suppose we want to model the number of arrivals per minute at the campus dining hall during lunch.We observe the actual arrivals in 200 one-minute periods in 1 week.The sample mean is 3.8 and the results are shown below.  The probabilities based on a Poisson distribution with a mean of 3.8 are shown below.
  Perform a formal test to determine if the observed counts are compatible with the Poisson distribution with a mean of 3.8 and a significance level of .05.
(Multiple Choice)
4.8/5 (33)
There was a wonderful study conducted in 1898 by von Bortkiewicz,which provides data on the death of soldiers in the Prussian army from kicks by horses and mules.The data pertain to 10 army corps,each observed over 20 years,for a total of 200 corps-years.The following table summarizes the observed data.Note that 109 corps-years had 0 deaths and 65 corps-years had 1 death,etc. 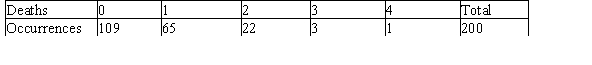 Von Bortkiewicz felt that a distribution known as the Poisson distribution would describe these data well.Using that distribution,he produced the following probabilities.
 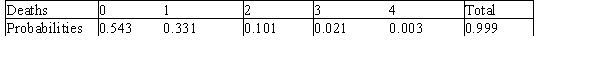 What is the appropriate null hypothesis to test if the observed cell counts follow the specified distribution?
(Multiple Choice)
4.9/5 (31)
Because statistical software plays such an important role in modern statistical applications,many studies have encouraged the use of technology in statistics courses.The Guidelines for the Assessment and Instruction in Statistics Education (GAISE)(Aliaga et al. ,2005)project was funded by the American Statistical Association to examine needs for college level statistics courses.One of the six recommendations from GAISE is the use of technology for developing conceptual understanding and analyzing data.A survey was sent to students at 100 different universities across the United States to access the relationship between ease of learning the statistical software program SAS and a student's currently level of SAS proficiency.The results of the survey are published in Jackson et al. ,2011,in the International Mathematical Forum journal and are shown below. Table 1.Two-way table for ease of learning SAS and SAS proficiency level. 
 What is the column proportion,B,for students who find SAS somewhat easy to learn and who are not proficient in SAS?
(Multiple Choice)
4.8/5 (30)
A simple random sample of 100 college students was interviewed.They were asked what size pizza they usually ordered and what their favorite topping was.The results are presented below. 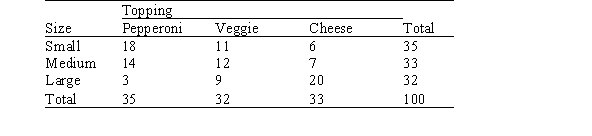 Under the null hypothesis that there is no association between pizza size and pizza topping,are the data statistically significant at the 10% significance level? (Hint: You do not need to calculate the actual value of the chi-square statistic to answer this question. )
(Multiple Choice)
4.8/5 (38)
Because statistical software plays such an important role in modern statistical applications,many studies have encouraged the use of technology in statistics courses.The Guidelines for the Assessment and Instruction in Statistics Education (GAISE)(Aliaga et al. ,2005)project was funded by the American Statistical Association to examine needs for college level statistics courses.One of the six recommendations from GAISE is the use of technology for developing conceptual understanding and analyzing data.A survey was sent to students at 100 different universities across the United States to access the relationship between ease of learning the statistical software program SAS and a student's currently level of SAS proficiency.The results of the survey are published in Jackson et al. ,2011,in the International Mathematical Forum journal and are shown below. Table 1.Two-way table for ease of learning SAS and SAS proficiency level. 
 What is the column proportion,F,for students who find SAS very easy to learn and who are somewhat proficient in SAS?
(Multiple Choice)
4.9/5 (37)
A simple random sample of 100 college students was interviewed.They were asked what size pizza they usually ordered and what their favorite topping was.The results are presented below.  What are the appropriate degrees of freedom for the chi-square statistic under the null hypothesis that there is no association between pizza size and pizza topping?
(Multiple Choice)
4.7/5 (37)
An agency responsible for coordinating organ donations for the purpose of transplantation conducted a survey in four different regions of Canada.In each region-West,Prairies,Central,and Atlantic-separate surveys were conducted.One question addressed attitudes with respect to the use of unrelated living donors for kidney transplantation.The following table summarizes the findings in these regions. 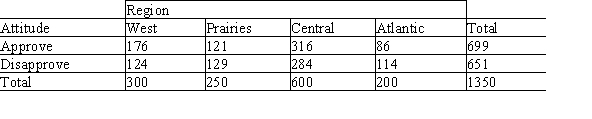 The agency was interested in determining if the proportion of people who approve of unrelated living kidney donation is the same across the various regions. What is the appropriate null hypothesis that the agency should establish?
(Multiple Choice)
4.8/5 (32)
Because statistical software plays such an important role in modern statistical applications,many studies have encouraged the use of technology in statistics courses.The Guidelines for the Assessment and Instruction in Statistics Education (GAISE)(Aliaga et al. ,2005)project was funded by the American Statistical Association to examine needs for college level statistics courses.One of the six recommendations from GAISE is the use of technology for developing conceptual understanding and analyzing data.A survey was sent to students at 100 different universities across the United States to access the relationship between ease of learning the statistical software program SAS and a student's currently level of SAS proficiency.The results of the survey are published in Jackson et al. ,2011,in the International Mathematical Forum journal and are shown below. Table 1.Two-way table for ease of learning SAS and SAS proficiency level. 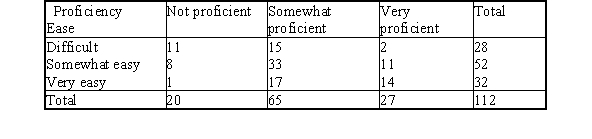
 Perform a formal test to determine if there is a relationship between ease of learning SAS and SAS proficiency at the .05 significance level.
(Multiple Choice)
4.9/5 (38)
The Poisson distribution is a discrete distribution that expresses the probability of a fixed number of events occurring in a fixed interval.For example,suppose we want to model the number of arrivals per minute at the campus dining hall during lunch.We observe the actual arrivals in 200 one-minute periods in 1 week.The sample mean is 3.8 and the results are shown below. 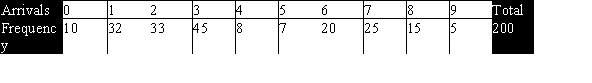 The probabilities based on a Poisson distribution with a mean of 3.8 are shown below.
 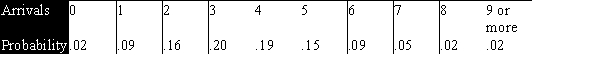 What is the expected count for 0 arrivals?
(Multiple Choice)
4.7/5 (42)
Two-way tables are for use on data derived from __________.
(Multiple Choice)
4.8/5 (30)
The sum of the column percents in a two-way table should be very close to _____.
(Multiple Choice)
4.7/5 (41)
Because statistical software plays such an important role in modern statistical applications,many studies have encouraged the use of technology in statistics courses.The Guidelines for the Assessment and Instruction in Statistics Education (GAISE)(Aliaga et al. ,2005)project was funded by the American Statistical Association to examine needs for college level statistics courses.One of the six recommendations from GAISE is the use of technology for developing conceptual understanding and analyzing data.A survey was sent to students at 100 different universities across the United States to access the relationship between ease of learning the statistical software program SAS and a student's currently level of SAS proficiency.The results of the survey are published in Jackson et al. ,2011,in the International Mathematical Forum journal and are shown below. Table 1.Two-way table for ease of learning SAS and SAS proficiency level. 
 What is the expected cell count for students who find SAS very easy to learn and who are not proficient?
(Multiple Choice)
4.7/5 (40)
Filters
- Essay(0)
- Multiple Choice(0)
- Short Answer(0)
- True False(0)
- Matching(0)