Exam 9: Inference for Categorical Data
Exam 1: Looking at Datadistributions127 Questions
Exam 2: Looking at Datarelationships48 Questions
Exam 3: Producing Data70 Questions
Exam 4: Probability: the Study of Randomness93 Questions
Exam 5: Sampling Distributions77 Questions
Exam 6: Introduction to Inference89 Questions
Exam 7: Inference for Means103 Questions
Exam 8: Inference for Proportions101 Questions
Exam 9: Inference for Categorical Data122 Questions
Exam 10: Inference for Regression91 Questions
Exam 11: Multiple Regression95 Questions
Exam 12: One-Way Analysis of Variance74 Questions
Exam 13: Two-Way Analysis of Variance53 Questions
Exam 14: Logistic Regression53 Questions
Exam 15: Nonparametric Tests57 Questions
Exam 16: Bootstrap Methods and Permutation Tests42 Questions
Exam 17: Statistics for Quality: Control and Capability86 Questions
Select questions type
Could mud wrestling be the cause of a rash contracted by University of Washington students in the spring of 1992? Two physicians at the University of Washington student health center wondered this when one male and six female students complained of rashes after participating in a mud-wrestling event.Questionnaires were sent to all students in the residence halls who participated in the event.The questionnaire asked about the appearance of a rash and about attendance at the mud-wrestling event.The results,by gender,are summarized in the following table. 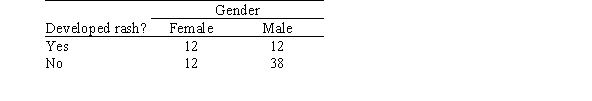 The SPSS output for the above table is given below.The output includes the cell counts,the expected cell counts,the chi-square statistic,and its degrees of freedom.Expected counts are printed below observed counts.
 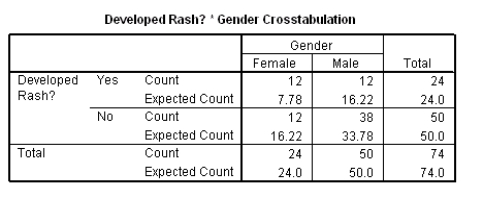 Chi-square = 2.289 + 1.098 + 1.098 + 0.527 = 5.002 df = 1,P-value = 0.0253
What conclusion can we draw from the above tables at the 5% significance level?
Chi-square = 2.289 + 1.098 + 1.098 + 0.527 = 5.002 df = 1,P-value = 0.0253
What conclusion can we draw from the above tables at the 5% significance level?
(Multiple Choice)
5.0/5  (27)
(27)
An agency responsible for coordinating organ donations for the purpose of transplantation conducted a survey in four different regions of Canada.In each region-West,Prairies,Central,and Atlantic-separate surveys were conducted.One question addressed attitudes with respect to the use of unrelated living donors for kidney transplantation.The following table summarizes the findings in these regions. 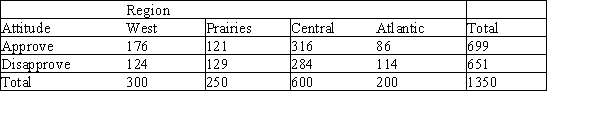 The agency was interested in determining if the proportion of people who approve of unrelated living kidney donation is the same across the various regions. The value of the test statistic under the appropriate null hypothesis is 13.21.The degrees of freedom and the approximate P-value for the test are,respectively,
(Multiple Choice)
4.8/5 (38)
Because statistical software plays such an important role in modern statistical applications,many studies have encouraged the use of technology in statistics courses.The Guidelines for the Assessment and Instruction in Statistics Education (GAISE)(Aliaga et al. ,2005)project was funded by the American Statistical Association to examine needs for college level statistics courses.One of the six recommendations from GAISE is the use of technology for developing conceptual understanding and analyzing data.A survey was sent to students at 100 different universities across the United States to access the relationship between ease of learning the statistical software program SAS and a student's currently level of SAS proficiency.The results of the survey are published in Jackson et al. ,2011,in the International Mathematical Forum journal and are shown below. Table 1.Two-way table for ease of learning SAS and SAS proficiency level. 
 What is the expected cell count for students who find SAS difficult to learn and who are not proficient?
(Multiple Choice)
4.8/5 (32)
The student newspaper called Campus Press polled a simple random sample of 280 undergraduate students in order to study student attitude toward a proposed change in dormitory regulations.Students responded as supporting,opposing,or standing neutral with regards to the issue.The numbers are displayed in the table below. 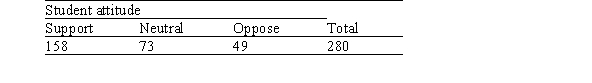 Under the appropriate null hypothesis,are the data statistically significant at the 5% significance level?
(Multiple Choice)
4.9/5 (31)
Recent revenue shortfalls in a Midwestern state led to a reduction in the state budget for higher education.To offset the reduction,the largest state university proposed a 25% tuition increase.It was determined that such an increase was needed to simply compensate for the lost support from the state.Random samples of 50 freshmen,50 sophomores,50 juniors,and 50 seniors from the university were asked whether or not they were strongly opposed to the increase,given that it was the minimum increase necessary to maintain the university's budget at current levels.The results are given in the following table.  At the 5% significance level,what is the largest value the chi-square statistic could be,before rejecting the appropriate null hypothesis?
(Multiple Choice)
4.7/5 (36)
Are avid readers more likely to wear glasses than those who read less frequently? Three hundred men in Ohio were selected at random and characterized as to whether they wore glasses and whether the amount of reading they did was above average,average,or below average.The results are presented in the following table. 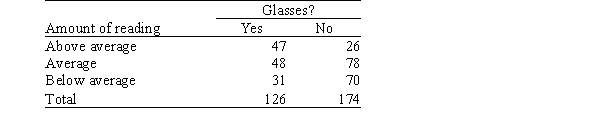 Suppose we wish to test the null hypothesis that there is no association between the amount of reading and wearing glasses.Under the null hypothesis,what is the numerical value of the chi-square statistic?
(Multiple Choice)
4.7/5 (39)
The 94 students in a statistics class are categorized by gender and by the year in school.The numbers obtained are displayed below. 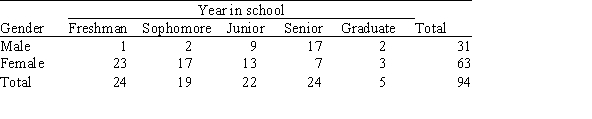 Suppose we wish to test the null hypothesis that there is no association between the year in school and gender.Under the null hypothesis,what is the expected number of male sophomores?
(Multiple Choice)
4.7/5 (32)
Recent revenue shortfalls in a Midwestern state led to a reduction in the state budget for higher education.To offset the reduction,the largest state university proposed a 25% tuition increase.It was determined that such an increase was needed to simply compensate for the lost support from the state.Random samples of 50 freshmen,50 sophomores,50 juniors,and 50 seniors from the university were asked whether or not they were strongly opposed to the increase,given that it was the minimum increase necessary to maintain the university's budget at current levels.The results are given in the following table. 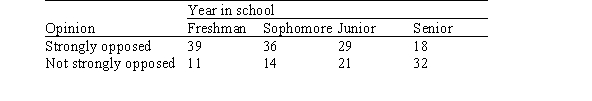 Suppose we wish to test the null hypothesis that there is no association between year in school and opinion.Under the null hypothesis,what is the expected number of strongly opposed seniors?
(Multiple Choice)
4.8/5 (44)
Recent revenue shortfalls in a Midwestern state led to a reduction in the state budget for higher education.To offset the reduction,the largest state university proposed a 25% tuition increase.It was determined that such an increase was needed to simply compensate for the lost support from the state.Random samples of 50 freshmen,50 sophomores,50 juniors,and 50 seniors from the university were asked whether or not they were strongly opposed to the increase,given that it was the minimum increase necessary to maintain the university's budget at current levels.The results are given in the following table. 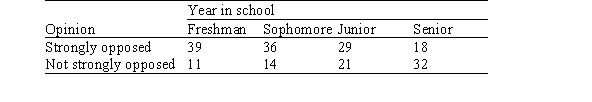 What is the contribution to the chi-square statistic from the cell of strongly opposed seniors?
(Multiple Choice)
4.7/5 (31)
Because statistical software plays such an important role in modern statistical applications,many studies have encouraged the use of technology in statistics courses.The Guidelines for the Assessment and Instruction in Statistics Education (GAISE)(Aliaga et al. ,2005)project was funded by the American Statistical Association to examine needs for college level statistics courses.One of the six recommendations from GAISE is the use of technology for developing conceptual understanding and analyzing data.A survey was sent to students at 100 different universities across the United States to access the relationship between ease of learning the statistical software program SAS and a student's currently level of SAS proficiency.The results of the survey are published in Jackson et al. ,2011,in the International Mathematical Forum journal and are shown below. Table 1.Two-way table for ease of learning SAS and SAS proficiency level. 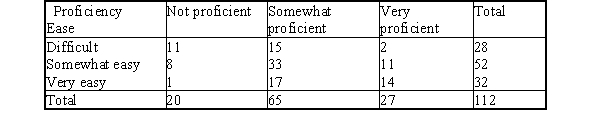
 What is the column proportion,C,for students who find SAS very easy to learn and who are not proficient in SAS?
(Multiple Choice)
4.8/5 (38)
A particular paperback mystery book is published with a choice of three different pictures on the cover: a photograph of the actor playing the main character in the movie version of the book,a drawing of the mansion where the story takes place,or an embossed graphic of the murder weapon.A certain bookstore keeps copies of this book with each of the pictures on the cover on its racks.To test the hypothesis that sales of this book are equally divided among the three choices,a simple random sample of 120 purchases of this book is obtained.The numbers are displayed in the table below. 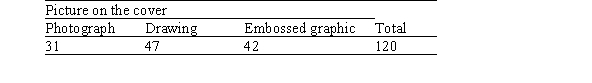 Under the null hypothesis that sales are equally divided among the three different covers,what is the value of the expected count for sales of the book with the photograph of the actor on the cover?
(Multiple Choice)
5.0/5 (36)
Because statistical software plays such an important role in modern statistical applications,many studies have encouraged the use of technology in statistics courses.The Guidelines for the Assessment and Instruction in Statistics Education (GAISE)(Aliaga et al. ,2005)project was funded by the American Statistical Association to examine needs for college level statistics courses.One of the six recommendations from GAISE is the use of technology for developing conceptual understanding and analyzing data.A survey was sent to students at 100 different universities across the United States to access the relationship between ease of learning the statistical software program SAS and a student's currently level of SAS proficiency.The results of the survey are published in Jackson et al. ,2011,in the International Mathematical Forum journal and are shown below. Table 1.Two-way table for ease of learning SAS and SAS proficiency level. 
 Which graph displays the correct distribution for comparing "very easy" ease of learning SAS and "somewhat proficient" proficiency?
(Multiple Choice)
4.7/5 (40)
Because statistical software plays such an important role in modern statistical applications,many studies have encouraged the use of technology in statistics courses.The Guidelines for the Assessment and Instruction in Statistics Education (GAISE)(Aliaga et al. ,2005)project was funded by the American Statistical Association to examine needs for college level statistics courses.One of the six recommendations from GAISE is the use of technology for developing conceptual understanding and analyzing data.A survey was sent to students at 100 different universities across the United States to access the relationship between ease of learning the statistical software program SAS and a student's currently level of SAS proficiency.The results of the survey are published in Jackson et al. ,2011,in the International Mathematical Forum journal and are shown below. Table 1.Two-way table for ease of learning SAS and SAS proficiency level. 
 What is the column proportion,A,for students who find SAS difficult to learn and who are not proficient in SAS?
(Multiple Choice)
4.8/5 (32)
A study was performed to examine the personal goals of children in grades 4,5,and 6.A random sample of students was selected from each of the grades 4,5,and 6 from schools in Georgia.The students received a questionnaire regarding achieving personal goals.They were asked what they would most like to do at school: make good grades,be good at sports,or be popular.Results are presented by the gender of the child in the table below.  What is the value of the chi-square statistic based on the data presented in this table under the appropriate null hypothesis?
(Multiple Choice)
4.8/5 (37)
You will obtain a large value for 2 if expected cell counts and observed cell counts in any cell of a two-way table are very different.
(True/False)
4.9/5 (44)
Because statistical software plays such an important role in modern statistical applications,many studies have encouraged the use of technology in statistics courses.The Guidelines for the Assessment and Instruction in Statistics Education (GAISE)(Aliaga et al. ,2005)project was funded by the American Statistical Association to examine needs for college level statistics courses.One of the six recommendations from GAISE is the use of technology for developing conceptual understanding and analyzing data.A survey was sent to students at 100 different universities across the United States to access the relationship between ease of learning the statistical software program SAS and a student's currently level of SAS proficiency.The results of the survey are published in Jackson et al. ,2011,in the International Mathematical Forum journal and are shown below. Table 1.Two-way table for ease of learning SAS and SAS proficiency level. 
 What are the degrees of freedom for the test statistic used to test for a relationship between ease of learning SAS and SAS proficiency?
(Multiple Choice)
4.8/5 (45)
A study was performed to examine the personal goals of children in grades 4,5,and 6.A random sample of students was selected from each of the grades 4,5,and 6 from schools in Georgia.The students received a questionnaire regarding achieving personal goals.They were asked what they would most like to do at school: make good grades,be good at sports,or be popular.Results are presented by the gender of the child in the table below. 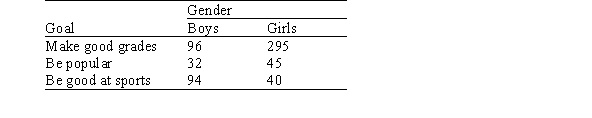 Under the appropriate null hypothesis,are the data statistically significant at the 5% significance level?
(Multiple Choice)
4.8/5 (38)
Simple random samples of 350 women and 450 men from Michigan are obtained.The 800 people in the sample are categorized according to where they went to school: in state,out of state,or no college. 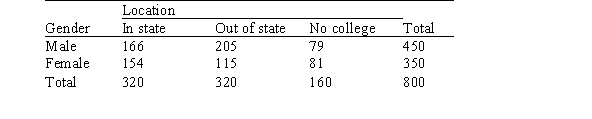 The SPSS output for the above table is given below.The output includes the cell counts and the most expected cell counts.Expected counts are printed below observed counts.
 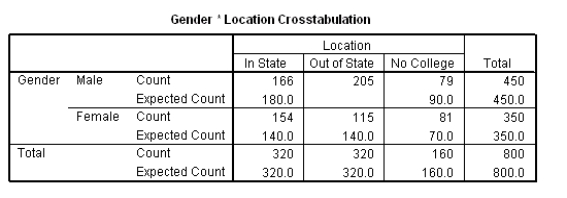 One of the expected counts is missing in the output.What is the value of the expected count for the male out-of-state cell?
(Multiple Choice)
4.9/5 (40)
Filters
- Essay(0)
- Multiple Choice(0)
- Short Answer(0)
- True False(0)
- Matching(0)