Exam 9: Inference for Categorical Data
Exam 1: Looking at Datadistributions127 Questions
Exam 2: Looking at Datarelationships48 Questions
Exam 3: Producing Data70 Questions
Exam 4: Probability: the Study of Randomness93 Questions
Exam 5: Sampling Distributions77 Questions
Exam 6: Introduction to Inference89 Questions
Exam 7: Inference for Means103 Questions
Exam 8: Inference for Proportions101 Questions
Exam 9: Inference for Categorical Data122 Questions
Exam 10: Inference for Regression91 Questions
Exam 11: Multiple Regression95 Questions
Exam 12: One-Way Analysis of Variance74 Questions
Exam 13: Two-Way Analysis of Variance53 Questions
Exam 14: Logistic Regression53 Questions
Exam 15: Nonparametric Tests57 Questions
Exam 16: Bootstrap Methods and Permutation Tests42 Questions
Exam 17: Statistics for Quality: Control and Capability86 Questions
Select questions type
To test the null hypothesis in r × c tables,we compare the observed counts with _____ counts.
(Short Answer)
4.7/5  (42)
(42)
A simple random sample of 100 college students was interviewed.They were asked what size pizza they usually ordered and what their favorite topping was.The results are presented below. 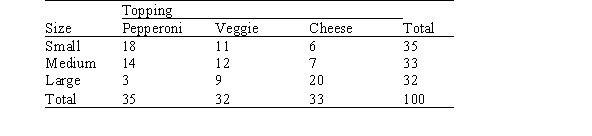 What is the contribution to the chi-square statistic from the cell of a large cheese pizza?
(Multiple Choice)
4.8/5 (39)
Recent revenue shortfalls in a Midwestern state led to a reduction in the state budget for higher education.To offset the reduction,the largest state university proposed a 25% tuition increase.It was determined that such an increase was needed to simply compensate for the lost support from the state.Random samples of 50 freshmen,50 sophomores,50 juniors,and 50 seniors from the university were asked whether or not they were strongly opposed to the increase,given that it was the minimum increase necessary to maintain the university's budget at current levels.The results are given in the following table. 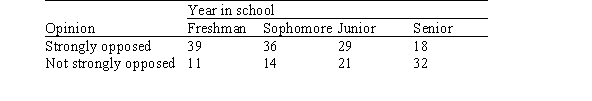 The chi-square statistic for these data equals 21.9.Are the data statistically significant at the 5% significance level under the appropriate null hypothesis?
(Multiple Choice)
5.0/5 (45)
Recent revenue shortfalls in a Midwestern state led to a reduction in the state budget for higher education.To offset the reduction,the largest state university proposed a 25% tuition increase.It was determined that such an increase was needed to simply compensate for the lost support from the state.Random samples of 50 freshmen,50 sophomores,50 juniors,and 50 seniors from the university were asked whether or not they were strongly opposed to the increase,given that it was the minimum increase necessary to maintain the university's budget at current levels.The results are given in the following table.  To compare the four classes (years in school)with respect to their opinions regarding the proposed tuition increase,which distribution should we calculate?
(Multiple Choice)
4.7/5 (32)
Simple random samples of 100 high school students are sampled from each grade level,for a total of 400 high school students.They are asked to rate the performance of the president of the United States on a scale from 1 to 5 (1 = poor and 5 = excellent).The results are presented below. 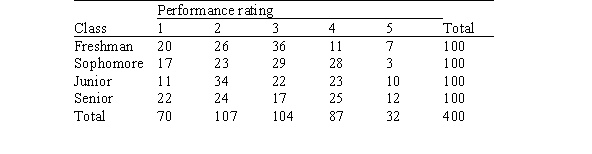 What would be the null hypothesis for a chi-square test based on these data?
(Essay)
4.8/5 (34)
Because statistical software plays such an important role in modern statistical applications,many studies have encouraged the use of technology in statistics courses.The Guidelines for the Assessment and Instruction in Statistics Education (GAISE)(Aliaga et al. ,2005)project was funded by the American Statistical Association to examine needs for college level statistics courses.One of the six recommendations from GAISE is the use of technology for developing conceptual understanding and analyzing data.A survey was sent to students at 100 different universities across the United States to access the relationship between ease of learning the statistical software program SAS and a student's currently level of SAS proficiency.The results of the survey are published in Jackson et al. ,2011,in the International Mathematical Forum journal and are shown below. Table 1.Two-way table for ease of learning SAS and SAS proficiency level. 
 What is the column proportion,G,for students who find SAS difficult to learn and who are very proficient in SAS?
(Multiple Choice)
4.8/5 (48)
A researcher is interested in determining if the model used for the distribution of main economic concerns in the year 2003 for residents in a certain county can still be used in the year 2004.A sample of 370 residents from that county was surveyed in 2004.The following table displays the model for the distribution of economic concerns for the year 2003 and the observed number of sampled respondents in the survey for the same economic concerns for the year 2004. 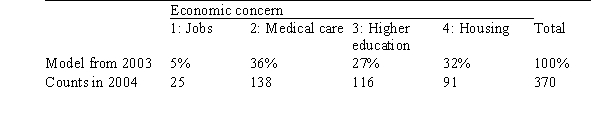 Let p1,p2,p3,and p4 be the proportion of all residents in this county who would list each of the economic concerns as priority for the year 2004.What would be the null hypothesis for a chi-square test for testing if the model from the previous year can still be used?
(Multiple Choice)
4.8/5 (34)
Because statistical software plays such an important role in modern statistical applications,many studies have encouraged the use of technology in statistics courses.The Guidelines for the Assessment and Instruction in Statistics Education (GAISE)(Aliaga et al. ,2005)project was funded by the American Statistical Association to examine needs for college level statistics courses.One of the six recommendations from GAISE is the use of technology for developing conceptual understanding and analyzing data.A survey was sent to students at 100 different universities across the United States to access the relationship between ease of learning the statistical software program SAS and a student's currently level of SAS proficiency.The results of the survey are published in Jackson et al. ,2011,in the International Mathematical Forum journal and are shown below. Table 1.Two-way table for ease of learning SAS and SAS proficiency level. 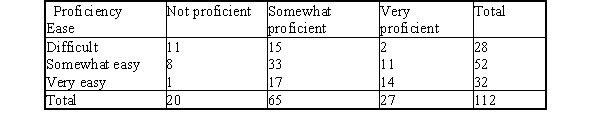
 What is the column proportion,E,for students who find SAS somewhat easy to learn and who are somewhat proficient in SAS?
(Multiple Choice)
4.8/5 (29)
A particular paperback mystery book is published with a choice of three different pictures on the cover: a photograph of the actor playing the main character in the movie version of the book,a drawing of the mansion where the story takes place,or an embossed graphic of the murder weapon.A certain bookstore keeps copies of this book with each of the pictures on the cover on its racks.To test the hypothesis that sales of this book are equally divided among the three choices,a simple random sample of 120 purchases of this book is obtained.The numbers are displayed in the table below.  At the 10% significance level,do we reject the null hypothesis that sales are equally divided among the three different covers?
(Multiple Choice)
4.8/5 (42)
A particular paperback mystery book is published with a choice of three different pictures on the cover: a photograph of the actor playing the main character in the movie version of the book,a drawing of the mansion where the story takes place,or an embossed graphic of the murder weapon.A certain bookstore keeps copies of this book with each of the pictures on the cover on its racks.To test the hypothesis that sales of this book are equally divided among the three choices,a simple random sample of 120 purchases of this book is obtained.The numbers are displayed in the table below.  What are the appropriate degrees of freedom for the chi-square statistic under the null hypothesis that sales are equally divided among the three different covers?
(Multiple Choice)
4.8/5 (38)
The chi-square test always uses the ____ tail of the 2 distribution.
(Multiple Choice)
4.9/5 (40)
There have been many studies that looked at the incidence of heart attack on the different days of the week.Studies in Japan and Scotland seemed to find that there was a substantial "spike" in heart attacks on Mondays,perhaps as much as 20% more.A researcher studied a random selection of 200 heart attack victims and recorded the day of the week that their attack occurred.The following table summarizes the results. 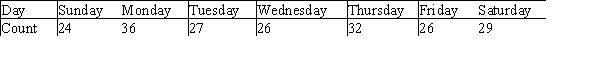 The researcher was interested in whether the distribution of heart attacks was the same or different across the days of the week. What are the null and alternative hypotheses the researcher should establish?
(Multiple Choice)
4.8/5 (25)
Because statistical software plays such an important role in modern statistical applications,many studies have encouraged the use of technology in statistics courses.The Guidelines for the Assessment and Instruction in Statistics Education (GAISE)(Aliaga et al. ,2005)project was funded by the American Statistical Association to examine needs for college level statistics courses.One of the six recommendations from GAISE is the use of technology for developing conceptual understanding and analyzing data.A survey was sent to students at 100 different universities across the United States to access the relationship between ease of learning the statistical software program SAS and a student's currently level of SAS proficiency.The results of the survey are published in Jackson et al. ,2011,in the International Mathematical Forum journal and are shown below. Table 1.Two-way table for ease of learning SAS and SAS proficiency level. 
 How many students were involved in the study?
(Multiple Choice)
4.8/5 (47)
The null hypothesis H0 in a two-way table represents which of the following?
(Multiple Choice)
4.9/5 (38)
A simple random sample of 100 college students was interviewed.They were asked what size pizza they usually ordered and what their favorite topping was.The results are presented below.  What would be the null hypothesis for a chi-square test based on these data?
(Multiple Choice)
4.7/5 (33)
There was a wonderful study conducted in 1898 by von Bortkiewicz,which provides data on the death of soldiers in the Prussian army from kicks by horses and mules.The data pertain to 10 army corps,each observed over 20 years,for a total of 200 corps-years.The following table summarizes the observed data.Note that 109 corps-years had 0 deaths and 65 corps-years had 1 death,etc. 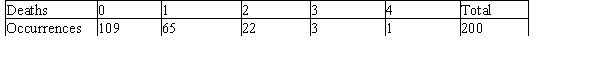 Von Bortkiewicz felt that a distribution known as the Poisson distribution would describe these data well.Using that distribution,he produced the following probabilities.
 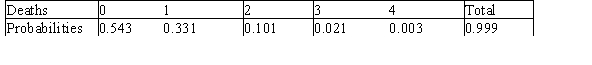 Under the null hypothesis that the observed cell counts follow the specified distribution,what is the distribution of the test statistic?
(Multiple Choice)
4.9/5 (33)
A researcher is interested in determining if the model used for the distribution of main economic concerns in the year 2003 for residents in a certain county can still be used in the year 2004.A sample of 370 residents from that county was surveyed in 2004.The following table displays the model for the distribution of economic concerns for the year 2003 and the observed number of sampled respondents in the survey for the same economic concerns for the year 2004. 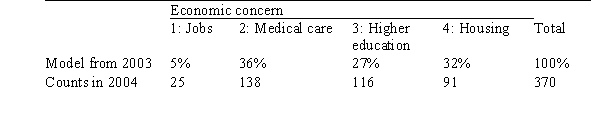 The chi-square statistic for these data equals 11.4.What do we know about the P-value for testing if the model from the previous year can still be used?
(Multiple Choice)
4.9/5 (37)
Because statistical software plays such an important role in modern statistical applications,many studies have encouraged the use of technology in statistics courses.The Guidelines for the Assessment and Instruction in Statistics Education (GAISE)(Aliaga et al. ,2005)project was funded by the American Statistical Association to examine needs for college level statistics courses.One of the six recommendations from GAISE is the use of technology for developing conceptual understanding and analyzing data.A survey was sent to students at 100 different universities across the United States to access the relationship between ease of learning the statistical software program SAS and a student's currently level of SAS proficiency.The results of the survey are published in Jackson et al. ,2011,in the International Mathematical Forum journal and are shown below. Table 1.Two-way table for ease of learning SAS and SAS proficiency level. 
 What is the value of L?
(Multiple Choice)
4.8/5 (31)
Filters
- Essay(0)
- Multiple Choice(0)
- Short Answer(0)
- True False(0)
- Matching(0)