Exam 9: Inference for Categorical Data
Exam 1: Looking at Datadistributions127 Questions
Exam 2: Looking at Datarelationships48 Questions
Exam 3: Producing Data70 Questions
Exam 4: Probability: the Study of Randomness93 Questions
Exam 5: Sampling Distributions77 Questions
Exam 6: Introduction to Inference89 Questions
Exam 7: Inference for Means103 Questions
Exam 8: Inference for Proportions101 Questions
Exam 9: Inference for Categorical Data122 Questions
Exam 10: Inference for Regression91 Questions
Exam 11: Multiple Regression95 Questions
Exam 12: One-Way Analysis of Variance74 Questions
Exam 13: Two-Way Analysis of Variance53 Questions
Exam 14: Logistic Regression53 Questions
Exam 15: Nonparametric Tests57 Questions
Exam 16: Bootstrap Methods and Permutation Tests42 Questions
Exam 17: Statistics for Quality: Control and Capability86 Questions
Select questions type
When a police officer responds to a call for help in a case of spousal abuse,what should the officer do? A randomized controlled experiment in Charlotte,North Carolina,studied three police responses to spousal abuse: advise and possibly separate the couple,issue a citation to the offender,and arrest the offender.The effectiveness of the three responses was determined by re-arrest rates.The table below shows these rates. 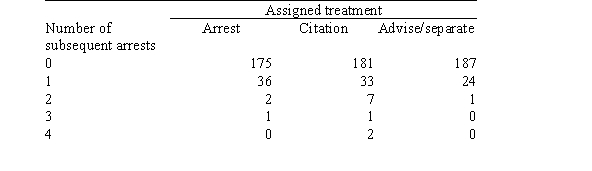 What is the proportion of all cases in which the assigned treatment was "Advise/separate"?
(Multiple Choice)
4.7/5  (35)
(35)
Simple random samples of 350 women and 450 men from Michigan are obtained.The 800 people in the sample are categorized according to where they went to school: in state,out of state,or no college. 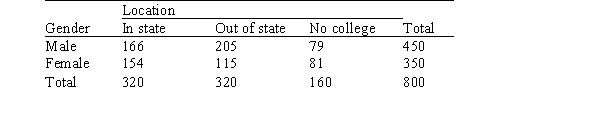 The SPSS output for the above table is given below.The output includes the cell counts and the most expected cell counts.Expected counts are printed below observed counts.
 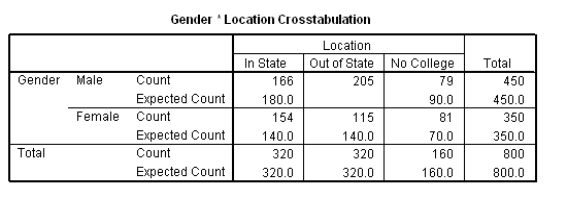 What would be the null hypothesis for a chi-square test based on these data?
(Multiple Choice)
4.9/5 (45)
The chi-square distribution is described by a single parameter called the _______.
(Multiple Choice)
5.0/5 (38)
A study was performed to examine the personal goals of children in grades 4,5,and 6.A random sample of students was selected from each of the grades 4,5,and 6 from schools in Georgia.The students received a questionnaire regarding achieving personal goals.They were asked what they would most like to do at school: make good grades,be good at sports,or be popular.Results are presented by the gender of the child in the table below. 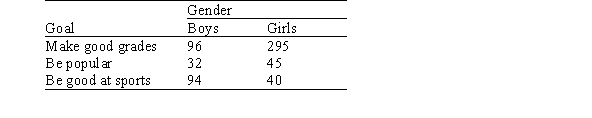 What would be the null hypothesis for a chi-square test based on these data?
(Multiple Choice)
4.8/5 (41)
Are avid readers more likely to wear glasses than those who read less frequently? Three hundred men in Ohio were selected at random and characterized as to whether they wore glasses and whether the amount of reading they did was above average,average,or below average.The results are presented in the following table. 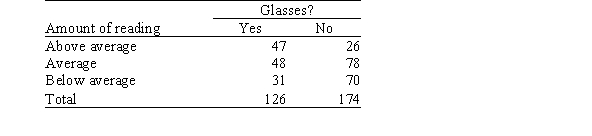 Suppose we wish to test the null hypothesis that there is no association between the amount of reading and wearing glasses.Under the null hypothesis,what is the expected number of above average readers who wear glasses?
(Multiple Choice)
4.8/5 (37)
Even though Puerto Rico is a commonwealth of the United States,there are many cultural differences between the states on the continent and the island of Puerto Rico.These differences include the way consumers handle problems with purchases.Two researchers surveyed owners of DVD players in the Northeast United States and in Puerto Rico.They asked those who had experienced problems with their DVD players whether they complained.The results are given in the table below. 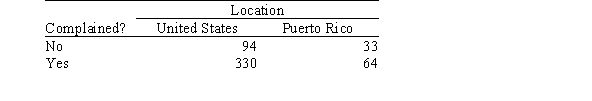 The SPSS output for the above table is given below.The output includes the cell counts,the expected cell counts,and the chi-square statistic.Expected counts are printed below observed counts.
 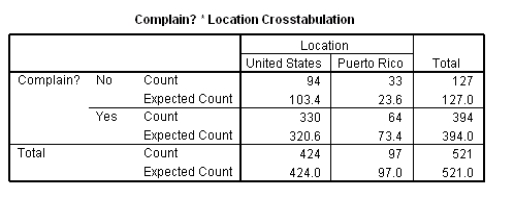 Chi-square = 0.855 + 3.744 + 0.276 + 1.204 = 6.079 What are the appropriate degrees of freedom for the chi-square statistic under the appropriate null hypotheis?
(Multiple Choice)
4.8/5 (36)
The student newspaper called Campus Press polled a simple random sample of 280 undergraduate students in order to study student attitude toward a proposed change in dormitory regulations.Students responded as supporting,opposing,or standing neutral with regards to the issue.The numbers are displayed in the table below.  Suppose that the Campus Press suspects that half of the students support the change in regulations and 20% of them oppose (leaving 30% to be neutral).What would be the null hypothesis for a chi-square test based on this suspicion?
(Multiple Choice)
4.9/5 (40)
The national distribution of scores on the Advanced Placement (AP)examination in statistics (out of a possible 5 points)is provided in the following table.  A simple random sample of 100 high school students who took the AP exam in statistics is taken from the high schools in a certain school district.The observed counts based on this sample of students are provided in the following table.
  What would be the null hypothesis for a chi-square test for testing if the national model can be used for students in this school district?
(Short Answer)
4.8/5 (32)
The Poisson distribution is a discrete distribution that expresses the probability of a fixed number of events occurring in a fixed interval.For example,suppose we want to model the number of arrivals per minute at the campus dining hall during lunch.We observe the actual arrivals in 200 one-minute periods in 1 week.The sample mean is 3.8 and the results are shown below. 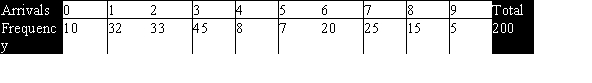 The probabilities based on a Poisson distribution with a mean of 3.8 are shown below.
 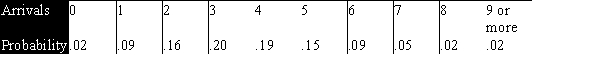 How many degrees of freedom is the goodness-of-fit test statistic based on?
(Multiple Choice)
4.8/5 (35)
The student newspaper called Campus Press polled a simple random sample of 280 undergraduate students in order to study student attitude toward a proposed change in dormitory regulations.Students responded as supporting,opposing,or standing neutral with regards to the issue.The numbers are displayed in the table below.  What is the value of the chi-square statistic under the appropriate null hypothesis?
(Multiple Choice)
4.7/5 (40)
The alternative hypothesis Ha in a two-way table represents which of the following?
(Multiple Choice)
4.8/5 (42)
The following table provides the results of a study in a major hospital concerning patients and their supplemental health coverage.A random sample of 95 surgical patients showed that 36 had supplemental health coverage;in a second random sample of 125 medical patients,56 had coverage.  If we wanted to test for the equality of the proportion of patients of the two types that have supplemental health coverage (i.e. ,H0:
  against Ha:
  ),which of the following statements about the appropriate analysis (at the = 0.05 level)would be FALSE?
(Multiple Choice)
4.8/5 (48)
Because statistical software plays such an important role in modern statistical applications,many studies have encouraged the use of technology in statistics courses.The Guidelines for the Assessment and Instruction in Statistics Education (GAISE)(Aliaga et al. ,2005)project was funded by the American Statistical Association to examine needs for college level statistics courses.One of the six recommendations from GAISE is the use of technology for developing conceptual understanding and analyzing data.A survey was sent to students at 100 different universities across the United States to access the relationship between ease of learning the statistical software program SAS and a student's currently level of SAS proficiency.The results of the survey are published in Jackson et al. ,2011,in the International Mathematical Forum journal and are shown below. Table 1.Two-way table for ease of learning SAS and SAS proficiency level. 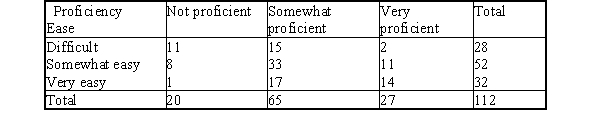
 Which graph displays the correct distribution for comparing "very easy" ease of learning SAS and "not proficient" proficiency?
(Multiple Choice)
5.0/5 (44)
A review of voter registration records in a small town yielded the following table of the number of males and females registered as Democrat,Republican,or some other affiliation. 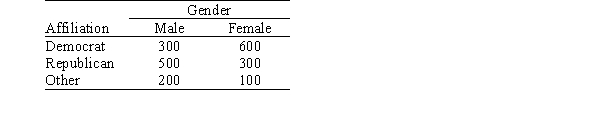 Suppose we wish to test the null hypothesis that there is no association between party affiliation and gender.Under the null hypothesis,what is the expected number of male Democrats?
(Multiple Choice)
4.8/5 (40)
A particular paperback mystery book is published with a choice of three different pictures on the cover: a photograph of the actor playing the main character in the movie version of the book,a drawing of the mansion where the story takes place,or an embossed graphic of the murder weapon.A certain bookstore keeps copies of this book with each of the pictures on the cover on its racks.To test the hypothesis that sales of this book are equally divided among the three choices,a simple random sample of 120 purchases of this book is obtained.The numbers are displayed in the table below.  What is the value of the chi-square statistic under the null hypothesis that sales are equally divided among the three different covers?
(Multiple Choice)
4.9/5 (39)
It is thought that people with psychopathic traits are bigger risk takers than people with non-psychopathic traits.A study was conducted by asking participants to fill out surveys to detect whether or not they are psychopathic.Then each subject played a game their measured their risk-taking propensity as either a low-risk taker or a high-risk taker.Could this study be analyzed using a two-way table?
(Multiple Choice)
4.7/5 (30)
Are avid readers more likely to wear glasses than those who read less frequently? Three hundred men in Ohio were selected at random and characterized as to whether they wore glasses and whether the amount of reading they did was above average,average,or below average.The results are presented in the following table. 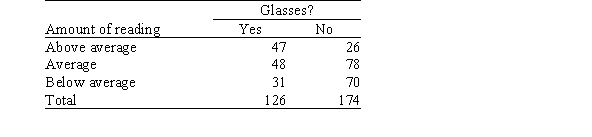 This is an r × c table.What is the value of the number r?
(Multiple Choice)
4.8/5 (39)
A researcher is interested in determining if the model used for the distribution of main economic concerns in the year 2003 for residents in a certain county can still be used in the year 2004.A sample of 370 residents from that county was surveyed in 2004.The following table displays the model for the distribution of economic concerns for the year 2003 and the observed number of sampled respondents in the survey for the same economic concerns for the year 2004. 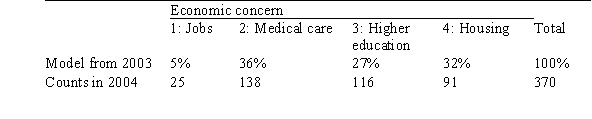 Under the null hypothesis that the model from the previous year can still be used,what is the distribution of the chi-square statistic?
(Multiple Choice)
4.8/5 (37)
There have been many studies that looked at the incidence of heart attack on the different days of the week.Studies in Japan and Scotland seemed to find that there was a substantial "spike" in heart attacks on Mondays,perhaps as much as 20% more.A researcher studied a random selection of 200 heart attack victims and recorded the day of the week that their attack occurred.The following table summarizes the results. 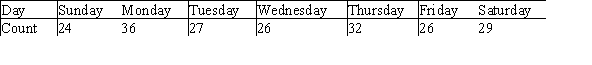 The researcher was interested in whether the distribution of heart attacks was the same or different across the days of the week. Under the appropriate null hypothesis,what is the expected number of heart attacks that occur on Monday?
(Multiple Choice)
4.8/5 (30)
Filters
- Essay(0)
- Multiple Choice(0)
- Short Answer(0)
- True False(0)
- Matching(0)