Exam 1: Looking at Datadistributions
Exam 1: Looking at Datadistributions127 Questions
Exam 2: Looking at Datarelationships48 Questions
Exam 3: Producing Data70 Questions
Exam 4: Probability: the Study of Randomness93 Questions
Exam 5: Sampling Distributions77 Questions
Exam 6: Introduction to Inference89 Questions
Exam 7: Inference for Means103 Questions
Exam 8: Inference for Proportions101 Questions
Exam 9: Inference for Categorical Data122 Questions
Exam 10: Inference for Regression91 Questions
Exam 11: Multiple Regression95 Questions
Exam 12: One-Way Analysis of Variance74 Questions
Exam 13: Two-Way Analysis of Variance53 Questions
Exam 14: Logistic Regression53 Questions
Exam 15: Nonparametric Tests57 Questions
Exam 16: Bootstrap Methods and Permutation Tests42 Questions
Exam 17: Statistics for Quality: Control and Capability86 Questions
Select questions type
The World Malaria Report (2008)has information on the number of reported malaria cases from 2005 and 2006 for the 10 countries listed in West Africa.The data are presented in the table below. 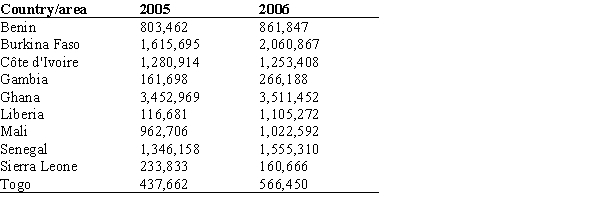 If the number of malaria cases for Sierra Leone were removed from this data set,what would happen to the mean of the entire data set for the year 2006?
(Multiple Choice)
4.8/5  (37)
(37)
In a statistics class with 136 students,the professor records how much money each student has in their possession during the first class of the semester.The histogram shown below represents the data he collected.  From the histogram,which of the following is TRUE?
(Multiple Choice)
4.9/5 (37)
The bar graph below represents the highest education level achieved for 30 random females and 60 random males questioned on a street in downtown Washington,DC. 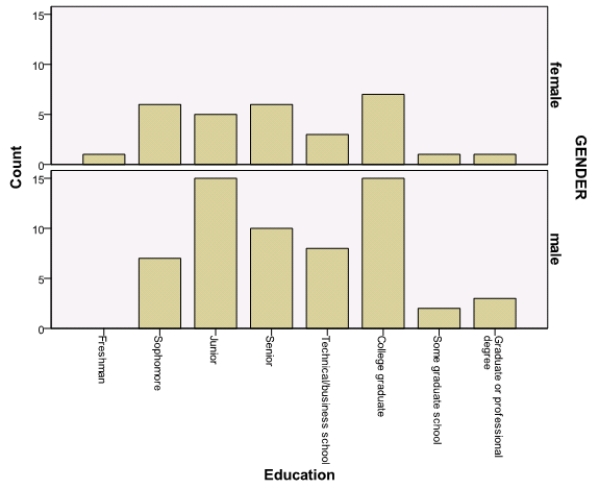 How many males completed at least some graduate school?
(Multiple Choice)
4.8/5 (39)
Consider the following data which describe the amount of time in minutes students spend studying for a quiz: 10,11,11,12,12,14,15,18,19,20,22,24,39,40,41,44,46,50,52,52,53,55,70.
What numbers make up the leaf of the first stem?
(Multiple Choice)
4.9/5 (38)
The histogram below represents the height (in inches)of the gold medal-winning high jumps for the Olympic Games up to Sydney 2000. 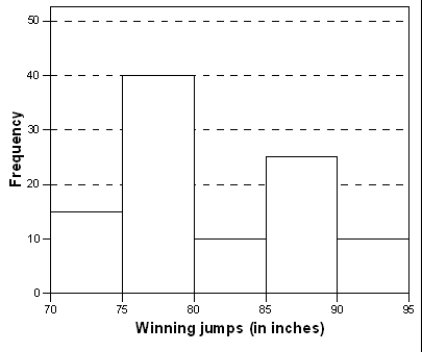 What is approximately the percentage of these winning jumps that were at least 7 feet and1 inch high (85 inches)?
(Multiple Choice)
4.9/5 (34)
Malaria is a leading cause of infectious disease and death worldwide.The table below represents the mean number of reported malaria cases (between 1996 and 2006)for each of 10 West African countries,as published in the journal Statistica Neerlandica in 2010. 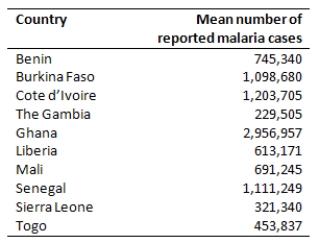 True or False.Making a histogram of the data would tell us if the distribution of the malaria data is symmetric.
(True/False)
4.7/5 (42)
The following stemplot displays the number of forest fires (in thousands)that occurred each year over the period from 1970 to 2000 in Canada,where 5|2 represents 5200 fires. 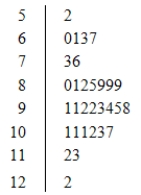 From the stemplot we can see that
(Multiple Choice)
4.7/5 (36)
Below is a data set with information on students in a basic statistics class at a local university.Are there any striking deviations from the overall pattern for the quantitative variable in the data set? 
(Multiple Choice)
4.7/5 (43)
Large data sets with quantitative variables are best displayed using ________.
(Multiple Choice)
4.9/5 (46)
The first day of class the professor collects information on each student to make a data set that will be analyzed throughout the semester.The information asked includes hometown,GPA,number of classes,number of siblings,and favorite subject.How many variables are in this data set?
(Multiple Choice)
4.9/5 (39)
Data are collected from 1100 randomly selected students who graduated between 2005 and 2008 from the University of Florida.A pie chart of the departments in the school/college from which the 1100 sampled students graduated is shown below. 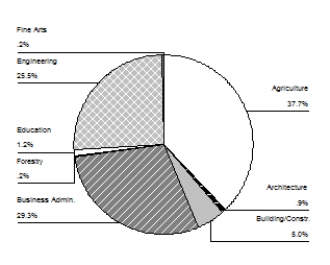 Based on the graph, (approximately)how many of the sampled students graduated with a degree in Building/Construction or Architecture?
(Multiple Choice)
4.8/5 (46)
According to the Bureau of Labor and Statistics in 2014,the average salary of all female workers is $37,596.The average salary of all male workers is $45,500.What must be true about the average salary of all workers?
(Multiple Choice)
4.8/5 (44)
The World Malaria Report (2008)has information on the number of reported malaria cases from 2005 and 2006 for the 10 countries listed in West Africa.The data are presented in the table below.  If the number of malaria cases for Ghana were removed from this data set,what would happen to the mean of the entire data set for the year 2005?
(Multiple Choice)
4.8/5 (28)
Below is a data set with information on students in a basic statistics class at a local university.Which variable is the label? 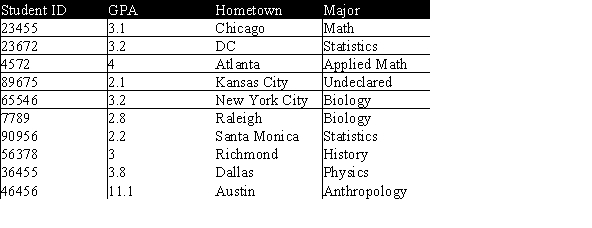
(Multiple Choice)
4.8/5 (40)
The following boxplot is of the birth weights (in ounces)of 160 infants born in a local hospital. 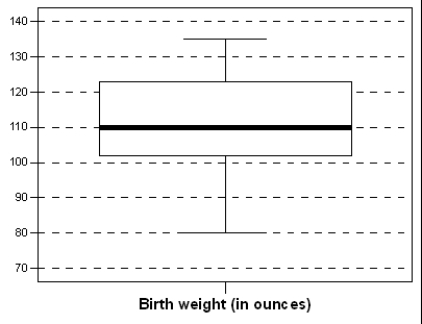 The median birth weight is approximately ________________.
(Multiple Choice)
4.9/5 (33)
In a statistics class with 136 students,the professor records how much money each student has in their possession during the first class of the semester.The histogram shown below represents the data he collected. 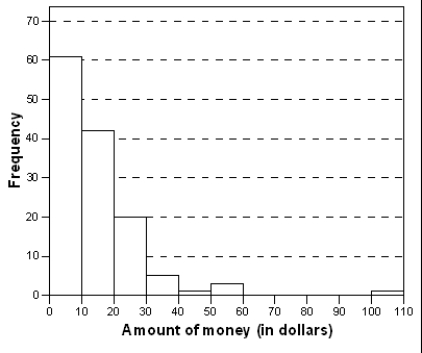 What is approximately the percentage of students with under $10 in their possession?
(Multiple Choice)
4.9/5 (40)
Filters
- Essay(0)
- Multiple Choice(0)
- Short Answer(0)
- True False(0)
- Matching(0)