Exam 1: Looking at Datadistributions
Exam 1: Looking at Datadistributions127 Questions
Exam 2: Looking at Datarelationships48 Questions
Exam 3: Producing Data70 Questions
Exam 4: Probability: the Study of Randomness93 Questions
Exam 5: Sampling Distributions77 Questions
Exam 6: Introduction to Inference89 Questions
Exam 7: Inference for Means103 Questions
Exam 8: Inference for Proportions101 Questions
Exam 9: Inference for Categorical Data122 Questions
Exam 10: Inference for Regression91 Questions
Exam 11: Multiple Regression95 Questions
Exam 12: One-Way Analysis of Variance74 Questions
Exam 13: Two-Way Analysis of Variance53 Questions
Exam 14: Logistic Regression53 Questions
Exam 15: Nonparametric Tests57 Questions
Exam 16: Bootstrap Methods and Permutation Tests42 Questions
Exam 17: Statistics for Quality: Control and Capability86 Questions
Select questions type
The salaries of Major League Baseball players range from several hundred thousand dollars per year to many millions per year.Suppose a histogram is made of all last year's salaries of Major League Baseball players.Which shape would best describe the shape of this histogram?
(Multiple Choice)
5.0/5  (29)
(29)
During the early part of the 1994 baseball season,many sports fans and baseball players noticed that the number of home runs being hit seemed to be unusually large.The numbers of home runs by American League and National League teams based on the team-by-team statistics on home runs hit through Friday,June 3,1994,are given below (from the Columbus Dispatch,Sunday,June 5,1994).
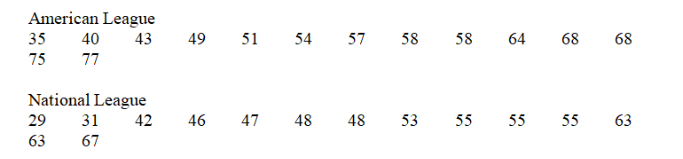 The mean and standard deviation of the number of home runs hit by National League teams are 50 and 11,respectively.Suppose we wish to measure how many more home runs than last year's average of 40 these teams have had this year by subtracting 40 from each number (a team with 55 home runs has 55 - 40 = 15 more home runs than last year's average).What are the mean and standard deviation of these new numbers?
(Multiple Choice)
4.8/5 (30)
Consider the following data which describe the amount of time in minutes students spend studying for a quiz: 10,11,11,12,12,14,15,18,19,20,22,24,39,40,41,44,46,50,52,52,53,55,70.
What numbers make up the leaf of the last stem?
(Multiple Choice)
5.0/5 (37)
A reporter wishes to portray baseball players as overpaid.Which measure of center should he report as the average salary of major league players?
(Multiple Choice)
4.8/5 (36)
The World Malaria Report (2008)has information on the number of reported malaria cases from 2005 and 2006 for the 10 countries listed in West Africa.The data are presented in the table below. 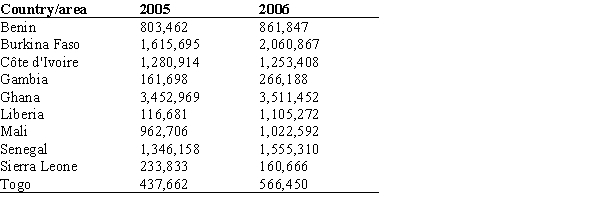 If the number of reported malaria cases in Ghana in 2005 were mistyped and reported as 30,452,969,what would happen to the mean and median?
(Multiple Choice)
4.9/5 (32)
During the early part of the 1994 baseball season,many sports fans and baseball players noticed that the number of home runs being hit seemed to be unusually large.Below are separate stemplots for the number of home runs by American League and National League teams based on the team-by-team statistics on home runs hit through Friday,June 3,1994 (from the Columbus Dispatch,Sunday,June 5,1994). 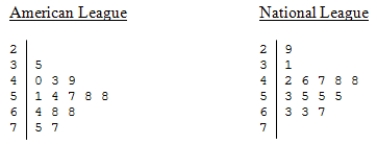 Legend: 2|9 represents 29. What is the maximum number of home runs from a National League team?
(Multiple Choice)
4.8/5 (38)
The pie chart provides information on all the majors at a university. 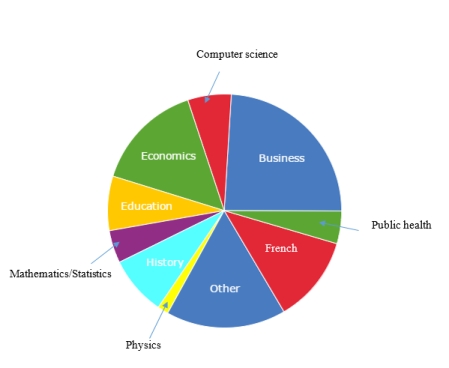 What conclusion can we draw based on this pie chart?
(Multiple Choice)
4.8/5 (25)
A study is being conducted on air quality at a small college in the South.As part of this study,monitors were posted at every entrance to this college from 6:00 a.m.to 10:00 p.m.on a randomly chosen day.The monitors recorded the mode of transportation used by each person as they entered the campus.Based on the information recorded,the following bar graph was constructed. 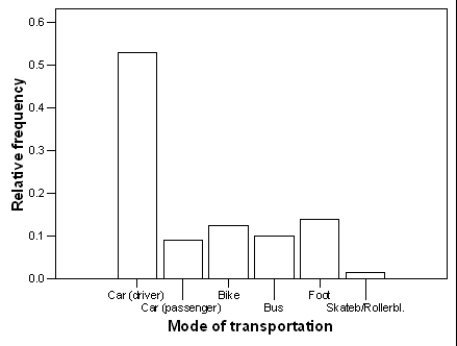 Approximately what percentage of people entering campus on this particular day arrived by car?
(Multiple Choice)
4.7/5 (40)
The asking prices (in thousands of dollars)for a sample of 13 houses currently on the market in Neighborville are listed below.For convenience,the data have been ordered.  Use the 1.5 × IQR rule to determine if there are any outliers present.What is/are the value(s)of the outlier(s)?
(Multiple Choice)
4.8/5 (46)
Thirty students were asked,"How much time did you spend studying for the last quiz?" The histograms below were all used on the same data;however,the class size was changed for each one.Which histogram below best displays the data?
(Multiple Choice)
4.8/5 (39)
Malaria is a leading cause of infectious disease and death worldwide.The table below represents the mean number of reported malaria cases (between 1996 and 2006)for each of 10 West African countries,as published in the journal Statistica Neerlandica in 2010. 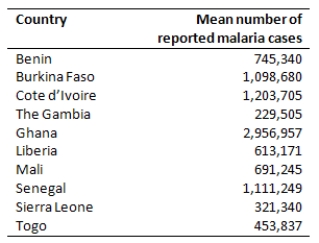 What is the best method to display these data?
(Multiple Choice)
4.8/5 (36)
We have a data set where the cases are college students.One of the variables in the data set is "gender." The values of gender are 1 if the student is male and 2 if the student is female.What type of variable is gender?
(Multiple Choice)
4.8/5 (47)
A sample of employees of a large pharmaceutical company has been obtained.The length of time (in months)they have worked for the company was recorded for each employee.A stemplot of these data is shown below.In the stemplot 6|2 represents 62 months. 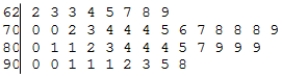 What would be a better way to represent this data set?
(Multiple Choice)
4.8/5 (36)
A consumer agency is testing appliances for a series of articles in their magazine.Currently they are working with cooktops and ranges.They have selected 16 of the most commonly used models.Using a series of tests,the agency will estimate the lifetime of these models.A histogram of these (estimated)lifetimes is shown below. 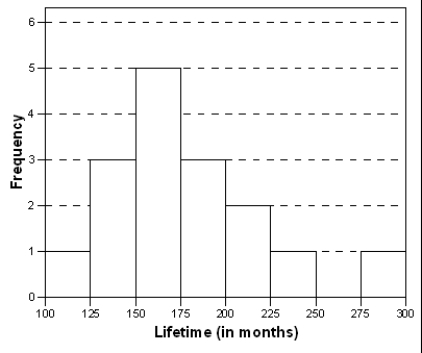 Select all correct descriptions for the shape of the histogram of the estimated lifetimes of these 16 appliances.
(Multiple Choice)
4.8/5 (40)
The stemplot below displays data from 30 students who were asked,"How much time in minutes do you spend on the Internet?" What do you notice about the stemplot? Variable: Time spent on the Internet
The decimal point is 2 digits to the right of the colon.
0 : 111123334
0 : 59
1 : 022
1 :
2 : 013333
2 : 5
3 : 224
3 :
4 :
4 :
5 : 4
5 : 678
6 :
6 : 5
7 :
7 :
8 :
8 : 7
(Multiple Choice)
4.9/5 (40)
In the fuel efficiency study of 2007 compact model automobiles,the following histogram of the distribution of the miles-per-gallon fuel efficiency rating in city driving (MPG-City)for automobiles manufactured in Europe was obtained. 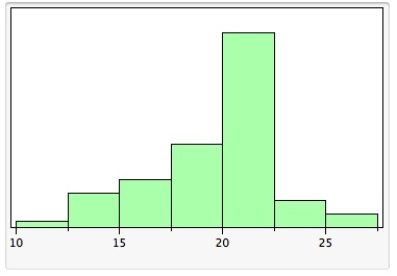 From the histogram above,showing the distribution of MPG-City,we can see that the
(Multiple Choice)
4.7/5 (38)
There are three children aged three,four,and five in a room.If another four-year-old child enters the room,what will happen to the mean and variance?
(Multiple Choice)
4.8/5 (28)
A sample of 16 people is taken,and their weights are measured.The standard deviation of these 16 measurements is computed to be 5.4.What is the variance of these measurements?
(Multiple Choice)
4.9/5 (43)
The first day of class the professor collects information on each student to make a data set that will be analyzed throughout the semester.The information asked includes hometown,GPA,number of classes,number of siblings,and favorite subject.How many categorical variables are in this data set?
(Multiple Choice)
4.8/5 (43)
We have a data set where the cases are college students.One of the variables in the data set is "grade." The values of grade are 4 if the student received an A,3 if the student received a B,2 if the student received a C,1 if the student received a D,and 0 if the student received an A.What type of variable is grade?
(Multiple Choice)
4.7/5 (42)
Filters
- Essay(0)
- Multiple Choice(0)
- Short Answer(0)
- True False(0)
- Matching(0)